|
|
|
|
BTS Table 1-11: U.S. Railway Rolling Stock 1960-1995
 |
| Light Rail |
2,856 |
1,549 |
1,262 |
1,061 |
1,013 |
717 |
910 |
1,092 |
1,055 |
1,001 |
1,051 |
1,048 |
| Heavy Rail
|
9,010 |
9,115 |
(R)
9,338 |
9,608 |
9,641 |
9,326 |
10,567 |
10,478 |
10,391 |
10,282 |
10,282 |
10,166 |
| Trolley Bus |
3,826 |
1,453 |
1,050 |
703 |
823 |
676 |
610 |
551 |
665 |
635 |
643 |
695 |
| Commuter Rail
and Locomotives |
U |
U |
U |
U |
4,500 |
4,035 |
4,982 |
5,126 |
5,164 |
4,982 |
5,126 |
5,164 |
| Demand Response |
U |
U |
U |
U |
U |
14,490 |
16,471 |
17,879 |
20,695 |
23,527 |
28,729 |
29,352 |
| Other |
U |
U |
U |
U |
U |
867 |
(R)
1,176 |
(R)
1,568 |
(R)
1,821 |
(R)
2,268 |
(R)
2,462 |
2,809 |
| Class I Freight |
1,658,292 |
1,478,005 |
1,423,921 |
1,359,459 |
1,168,114 |
867,070 |
658,902 |
633,489 |
605,189 |
587,033 |
590,930 |
583,486 |
| Class I Locomotive |
29,031 |
27,780 |
27,077 |
27,846 |
28,094 |
22,548 |
18,835 |
18,344 |
18,004 |
18,161 |
18,505 |
18,812 |
| Nonclass I Freight |
32,104 |
37,164 |
29,787 |
29,407 |
102,161 |
111,086 |
103,527 |
97,492 |
90,064 |
88,513 |
86,120 |
84,724 |
| Freight Companies Shippers |
275,090 |
285,493 |
330,473 |
334,739 |
440,552 |
443,530 |
449,832 |
458,679 |
477,883 |
497,586 |
515,362 |
550,717 |
| Amtrak Passenger Train |
U |
U |
U |
1,913 |
2,128 |
1,854 |
1,863 |
1,786 |
1,796 |
1,853 |
1,852 |
1,722 |
| Amtrak Locomotive |
U |
U |
U |
355 |
419 |
291 |
318 |
316 |
336 |
360 |
338 |
313 |
KEY: U = Data Unavailable; R =
Revised.
|
|
BTS Table 1-11: U.S. Railway Rolling Stock 1996-2007 |

| Light Rail |
1,114 |
1,078 |
1,076 |
1,180 |
1,327 |
1,371 |
1,448 |
1,482 |
1,622 |
1,645 |
1,801 |
1,810 |
| Heavy Rail |
10,243 |
10,228 |
10,296 |
10,362 |
10,311 |
10,718 |
10,849 |
10,754 |
10,858 |
11,110 |
11,052 |
11,222 |
| Trolley Bus |
675 |
655 |
646 |
657 |
652 |
600 |
616 |
672 |
597 |
615 |
609 |
559 |
| Commuter Rail and Locomotives |
5,240 |
5,426 |
5,536 |
5,550 |
5,498 |
5,572 |
5,724 |
5,959 |
6,228 |
6,392 |
6,403 |
6,391 |
| Demand Response |
30,804 |
32,509 |
29,646 |
31,884 |
33,080 |
34,661 |
34,699 |
35,954 |
37,078 |
41,958 |
43,509 |
64,865 |
| Other |
(R)
2,996 |
(R)
3,807 |
(R)
4,706 |
(R)
5,076 |
(R)
5,360 |
(R)
5,792 |
(R)
5,581 |
(R)
6,141 |
(R)
6,406 |
7,080 |
8,741 |
13,877 |
| Class I Freight |
570,865 |
568,493 |
575,604 |
579,140 |
560,154 |
499,860 |
477,751 |
467,063 |
473,773 |
474,839 |
475,415 |
460,172 |
| Class I Locomotive |
19,269 |
19,684 |
20,261 |
20,256 |
20,028 |
19,745 |
20,506 |
20,774 |
22,015 |
22,779 |
23,732 |
24,143 |
| Nonclass I Freight |
87,364 |
116,108 |
121,659 |
126,762 |
132,448 |
125,470 |
130,590 |
124,580 |
120,169 |
120,195 |
120,688 |
120,463 |
| Freight companies and shippers |
582,344 |
585,818 |
618,404 |
662,934 |
688,194 |
688,806 |
691,329 |
687,337 |
693,978 |
717,211 |
750,404 |
805,074 |
| Amtrak Passenger Train |
1,730 |
1,728 |
1,962 |
1,992 |
1,894 |
2,084 |
2,896 |
1,623 |
1,211 |
1,186 |
1,191 |
1,164 |
| Amtrak Locomotive |
299 |
332 |
345 |
329 |
378 |
401 |
372 |
442 |
276 |
258 |
319 |
270 |
KEY: U = data are unavailable; R =
revised.
|
|
BTS Table: 7 Incoming Passenger Trains Crossings U.S. Mexican Border |
| Arizona, Total |
NA |
NA |
NA |
NA |
NA |
900 |
4,752 |
2,648 |
2,216 |
1,664 |
| Douglas, AZ |
NA |
NA |
NA |
NA |
NA |
NA |
NA |
NA |
NA |
NA |
| Lukeville, AZ |
NA |
NA |
NA |
NA |
NA |
NA |
NA |
NA |
NA |
NA |
| Naco, AZ |
NA |
NA |
NA |
NA |
NA |
NA |
NA |
NA |
NA |
NA |
| Nogales, AZ |
NA |
NA |
NA |
NA |
NA |
900 |
4,752 |
2,648 |
2,216 |
1,664 |
| Sasabe, AZ |
NA |
NA |
NA |
NA |
NA |
NA |
NA |
NA |
NA |
NA |
| San Luis, AZ |
NA |
NA |
NA |
NA |
NA |
NA |
NA |
NA |
NA |
NA |
| California,
Total |
1,941 |
6,134 |
5,579 |
6,378 |
7,591 |
9,581 |
5,522 |
7,204 |
4,154 |
2,072 |
| Andrade, CA |
NA |
NA |
NA |
NA |
NA |
NA |
NA |
NA |
NA |
NA |
| Calexico, CA* |
917 |
1,848 |
1,728 |
301 |
U |
U |
9 |
U |
U |
U |
| Calexico East,
CA |
U |
U |
U |
1,253 |
1,589 |
1,743 |
1,687 |
1,722 |
1,934 |
1,456 |
| Otay Mesa/San
Ysidro, CA |
159 |
1,411 |
480 |
490 |
386 |
446 |
408 |
464 |
460 |
460 |
| Tecate, CA |
865 |
2,875 |
3,371 |
4,334 |
5,616 |
7,392 |
3,418 |
5,018 |
1,760 |
156 |
| New Mexico,
Total |
NA |
NA |
NA |
NA |
NA |
NA |
NA |
NA |
NA |
NA |
| Columbus, NM |
NA |
NA |
NA |
NA |
NA |
NA |
NA |
NA |
NA |
NA |
| Santa Teresa,
NM |
NA |
NA |
NA |
NA |
NA |
NA |
NA |
NA |
NA |
NA |
| Texas, Total |
2,604 |
7,088 |
5,706 |
5,126 |
5,100 |
5,688 |
7,980 |
9,043 |
8,738 |
8,365 |
| Brownsville,
TX |
2,156 |
2,089 |
NA |
NA |
NA |
NA |
NA |
NA |
NA |
NA |
| Del Rio, TX |
NA |
NA |
NA |
NA |
NA |
NA |
NA |
NA |
NA |
NA |
| Eagle Pass,
TX |
286 |
4,720 |
5,336 |
5,016 |
5,060 |
5,288 |
5,792 |
6,704 |
6,872 |
6,496 |
| El Paso, TX |
NA |
NA |
NA |
NA |
NA |
360 |
2,188 |
2,337 |
1,866 |
1,869 |
| Fabens, TX |
NA |
NA |
NA |
NA |
NA |
NA |
NA |
NA |
NA |
NA |
| Hidalgo, TX |
NA |
NA |
NA |
NA |
NA |
NA |
NA |
NA |
NA |
NA |
| Laredo, TX |
NA |
NA |
NA |
NA |
NA |
NA |
NA |
NA |
NA |
NA |
| Presidio, TX |
162 |
279 |
370 |
110 |
40 |
NA |
NA |
2 |
U |
U |
| Progreso, TX |
NA |
NA |
NA |
NA |
NA |
NA |
NA |
NA |
NA |
NA |
| Rio Grande City,
TX |
NA |
NA |
NA |
NA |
NA |
NA |
NA |
NA |
NA |
NA |
| Roma, TX |
NA |
NA |
NA |
NA |
NA |
NA |
NA |
NA |
NA |
NA |
| U.S. - Mexico
Border Total |
4,545 |
13,222 |
11,285 |
11,504 |
12,691 |
16,169 |
18,254 |
18,895 |
15,108 |
12,101 |
Key:
NA: Data not applicable
U: Data are unavailable
* Data for the port of Calexico are
typically reported as a combined total with Calexico
East.
Source: U.S. DOT, BTS based on data from
U.S. Customs Service, Mission Support Services, Office
of Field Operations, Operations Management Database.
|
|
|
BTS Table: 7a Incoming Passenger Trains Crossings U.S. Canadian Border |
| Alaska, Total |
25,008 |
18,767 |
23,068 |
22,323 |
30,580 |
28,166 |
35,253 |
33,753 |
29,754 |
44,430 |
| Alcan, AK |
NA |
NA |
NA |
NA |
NA |
NA |
NA |
NA |
NA |
NA |
| Dalton Cache,
AK |
NA |
NA |
NA |
NA |
NA |
NA |
NA |
NA |
NA |
NA |
| Skagway, AK |
25,008 |
18,767 |
23,068 |
22,323 |
30,580 |
28,166 |
35,253 |
33,753 |
29,754 |
44,430 |
| Idaho, Total |
1,200 |
1,518 |
1,329 |
1,446 |
1,731 |
2,019 |
2,097 |
2,109 |
2,226 |
1,868 |
| Eastport, ID |
1,200 |
1,518 |
1,329 |
1,446 |
1,731 |
2,019 |
2,097 |
2,109 |
2,226 |
1,868 |
| Porthill, ID |
NA |
NA |
NA |
NA |
NA |
NA |
NA |
NA |
NA |
NA |
| Maine, Total |
37,907 |
2,705 |
2,987 |
2,790 |
3,429 |
3,377 |
3,177 |
2,701 |
4,015 |
2,169 |
| Bridgewater,
ME |
NA |
NA |
NA |
NA |
NA |
NA |
NA |
NA |
NA |
NA |
| Calais, ME |
NA |
NA |
NA |
NA |
NA |
120 |
480 |
284 |
26 |
NA |
| Fort Fairfield,
ME |
NA |
NA |
NA |
NA |
NA |
NA |
NA |
NA |
NA |
NA |
| Fort Kent, ME |
NA |
NA |
NA |
NA |
NA |
NA |
NA |
NA |
NA |
NA |
| Houlton, ME |
NA |
NA |
NA |
NA |
NA |
NA |
NA |
NA |
NA |
NA |
| Jackman, ME |
3,286 |
804 |
1,433 |
1,304 |
1,770 |
1,665 |
1,230 |
920 |
1,823 |
670 |
| Limestone, ME |
NA |
NA |
NA |
NA |
NA |
NA |
NA |
NA |
NA |
NA |
| Madawaska, ME |
1,172 |
1,148 |
533 |
NA |
NA |
NA |
NA |
NA |
NA |
NA |
| Portland, ME
(ferry crossing) |
NA |
NA |
NA |
NA |
NA |
NA |
NA |
NA |
NA |
NA |
| Van Buren, ME |
NA |
NA |
408 |
832 |
779 |
803 |
835 |
793 |
1,353 |
923 |
| Vanceboro, ME |
33,449 |
753 |
613 |
654 |
880 |
789 |
632 |
704 |
813 |
576 |
| Michigan,
Total |
38,250 |
35,866 |
43,790 |
47,495 |
53,268 |
52,127 |
53,721 |
R47,545 |
41,734 |
39,855 |
| Algonac, MI |
NA |
NA |
NA |
NA |
NA |
NA |
NA |
NA |
NA |
NA |
| Detroit, MI |
NA |
1,950 |
12,234 |
11,938 |
12,255 |
11,528 |
11,792 |
R12,327 |
12,867 |
12,738 |
| PortHuron, MI |
36,904 |
32,687 |
28,973 |
33,412 |
39,846 |
39,288 |
40,633 |
33,130 |
26,815 |
25,485 |
| Sault Ste.
Marie, MI |
1,346 |
1,229 |
2,583 |
2,145 |
1,167 |
1,311 |
1,296 |
2,088 |
2,052 |
1,632 |
| Minnesota,
Total |
30,993 |
29,618 |
25,811 |
25,878 |
20,396 |
19,739 |
20,261 |
20,888 |
20,640 |
22,762 |
| Baudette, MN |
5,097 |
5,449 |
5,956 |
5,869 |
5,521 |
4,892 |
4,835 |
4,521 |
4,201 |
5,467 |
| Grand Portage,
MN |
NA |
NA |
NA |
NA |
NA |
NA |
NA |
NA |
NA |
NA |
| International
Falls, MN |
10,080 |
10,293 |
9,927 |
9,360 |
6,354 |
6,698 |
6,912 |
7,306 |
7,324 |
7,856 |
| Noyes, MN |
9,305 |
8,153 |
4,707 |
4,393 |
3,313 |
3,402 |
3,993 |
3,191 |
3,069 |
2,574 |
| Pinecreek, MN |
NA |
NA |
NA |
NA |
NA |
NA |
NA |
NA |
NA |
NA |
| Roseau, MN |
NA |
NA |
NA |
NA |
NA |
NA |
NA |
NA |
NA |
NA |
| Warroad, MN |
6,511 |
5,723 |
5,221 |
6,256 |
5,208 |
4,747 |
4,521 |
5,870 |
6,046 |
6,865 |
| U.S. - Canada
Border Total |
278,130 |
226,796 |
213,596 |
249,106 |
245,933 |
249,172 |
269,502 |
R253,652 |
225,380 |
190,366 |
Key:
U: Data unavailable
NA: Data not applicable
Source: U.S. DOT, BTS based on data from
U.S. Customs Service, Mission Support Services, Office
of Field Operations, Operations Management Database.
|
|
|
|
BTS Table: 7b Incoming Passenger Trains Crossings U.S.Canadian Border
|
| Montana, Total |
1,123 |
1,214 |
1,327 |
1,195 |
1,119 |
1,176 |
1,447 |
1,074 |
1,116 |
1,101 |
| Del Bonita, MT |
NA |
NA |
NA |
NA |
NA |
NA |
NA |
NA |
NA |
NA |
| Morgan, MT |
NA |
NA |
NA |
NA |
NA |
NA |
NA |
NA |
NA |
NA |
| Opheim, MT |
NA |
NA |
NA |
NA |
NA |
NA |
NA |
NA |
NA |
NA |
| Piegan, MT |
NA |
NA |
NA |
NA |
NA |
NA |
NA |
NA |
NA |
NA |
| Raymond, MT |
NA |
NA |
NA |
NA |
NA |
NA |
NA |
NA |
NA |
NA |
| Roosville, MT |
NA |
NA |
NA |
NA |
NA |
NA |
NA |
NA |
NA |
NA |
| Scobey, MT |
NA |
NA |
NA |
NA |
NA |
NA |
NA |
NA |
NA |
NA |
| Sweetgrass,
MT |
1,123 |
1,214 |
1,327 |
1,195 |
1,119 |
1,176 |
1,447 |
1,074 |
1,116 |
1,101 |
| Turner, MT |
NA |
NA |
NA |
NA |
NA |
NA |
NA |
NA |
NA |
NA |
| Whitetail, MT |
NA |
NA |
NA |
NA |
NA |
NA |
NA |
NA |
NA |
NA |
| Whitlash, MT |
NA |
NA |
NA |
NA |
NA |
NA |
NA |
NA |
NA |
NA |
| New York,
Total |
83,636 |
81,970 |
61,569 |
73,144 |
75,905 |
84,670 |
93,395 |
89,949 |
82,297 |
66,737 |
| Alexandria
Bay/Cape Vincent, NY |
NA |
NA |
NA |
NA |
NA |
NA |
NA |
NA |
NA |
NA |
| Buffalo-Niagara,
NY |
45,898 |
46,152 |
31,857 |
37,924 |
45,651 |
48,196 |
53,603 |
53,337 |
47,315 |
37,240 |
| Champlain-Rouse
Pt., NY |
31,816 |
33,111 |
27,686 |
33,424 |
28,483 |
34,806 |
38,459 |
35,257 |
33,738 |
28,325 |
| Massena, NY |
NA |
NA |
NA |
NA |
NA |
NA |
NA |
NA |
NA |
NA |
| Ogdensburg,
NY |
NA |
NA |
NA |
86 |
NA |
NA |
NA |
NA |
NA |
NA |
| Trout River/Fort
Covington/Chateaugay, NY |
5,922 |
2,707 |
2,026 |
1,710 |
1,771 |
1,668 |
1,333 |
1,355 |
1,244 |
1,172 |
| U.S. - Canada
Border Total |
278,130 |
226,796 |
213,596 |
249,106 |
245,933 |
249,172 |
269,502 |
R253,652 |
225,380 |
190,366 |
Key:
U: Data unavailable
NA: Data not applicable
Source: U.S. DOT, BTS based on data from
U.S. Customs Service, Mission Support Services, Office
of Field Operations, Operations Management Database.
|
|
|
BTS Table: 7c Incoming Passenger Trains Crossings U.S. Canadian Border |
| North Dakota,
Total |
3,456 |
3,904 |
3,849 |
4,094 |
4,441 |
4,774 |
5,181 |
5,285 |
5,757 |
5,786 |
| Ambrose, ND |
NA |
NA |
NA |
NA |
NA |
NA |
NA |
NA |
NA |
NA |
| Antler, ND |
NA |
NA |
NA |
NA |
NA |
NA |
NA |
NA |
NA |
NA |
| Carbury, ND |
NA |
NA |
NA |
NA |
NA |
NA |
NA |
NA |
NA |
NA |
| Dunseith, ND |
NA |
NA |
NA |
NA |
NA |
NA |
NA |
NA |
NA |
NA |
| Fortuna, ND |
NA |
NA |
NA |
NA |
NA |
NA |
NA |
NA |
NA |
NA |
| Hannah, ND |
NA |
NA |
NA |
NA |
NA |
NA |
NA |
NA |
NA |
NA |
| Hansboro, ND |
NA |
NA |
NA |
NA |
NA |
NA |
NA |
NA |
NA |
NA |
| Maida, ND |
NA |
NA |
NA |
NA |
NA |
NA |
NA |
NA |
NA |
NA |
| Neche, ND |
NA |
NA |
NA |
NA |
NA |
NA |
NA |
NA |
NA |
NA |
| Noonan, ND |
NA |
NA |
NA |
NA |
NA |
NA |
NA |
NA |
NA |
NA |
| Northgate, ND |
NA |
NA |
NA |
NA |
16 |
7 |
33 |
17 |
9 |
NA |
| Pembina, ND |
NA |
NA |
NA |
NA |
NA |
NA |
NA |
NA |
NA |
NA |
| Portal, ND |
3,456 |
3,904 |
3,849 |
4,094 |
4,425 |
4,767 |
5,148 |
5,268 |
5,748 |
5,786 |
| Sarles, ND |
NA |
NA |
NA |
NA |
NA |
NA |
NA |
NA |
NA |
NA |
| Sherwood, ND |
NA |
NA |
NA |
NA |
NA |
NA |
NA |
NA |
NA |
NA |
| St. John, ND |
NA |
NA |
NA |
NA |
NA |
NA |
NA |
NA |
NA |
NA |
| Walhalla, ND |
NA |
NA |
NA |
NA |
NA |
NA |
NA |
NA |
NA |
NA |
| Westhope, ND |
NA |
NA |
NA |
NA |
NA |
NA |
NA |
NA |
NA |
NA |
| Vermont,
Total |
45,600 |
12,634 |
3,306 |
3,668 |
3,160 |
2,800 |
2,601 |
2,429 |
2,362 |
2,066 |
| Beecher Falls,
VT |
NA |
NA |
NA |
NA |
NA |
NA |
NA |
NA |
NA |
NA |
| Derby Line,
VT |
1,000 |
944 |
193 |
NA |
NA |
NA |
NA |
NA |
NA |
NA |
| Highgate
Springs, VT |
42,842 |
9,953 |
722 |
677 |
691 |
711 |
706 |
707 |
722 |
714 |
| Norton, VT |
810 |
1,119 |
1,211 |
1,385 |
1,210 |
1,273 |
1,111 |
955 |
1,123 |
777 |
| Richford, VT |
948 |
618 |
1,180 |
1,606 |
1,259 |
816 |
784 |
767 |
517 |
575 |
| Washington,
Total |
10,957 |
38,600 |
46,560 |
67,073 |
51,904 |
50,324 |
52,369 |
47,919 |
65,233 |
48,022 |
| Blaine, WA |
4,115 |
31,943 |
40,293 |
60,777 |
45,310 |
43,040 |
46,343 |
43,136 |
60,521 |
43,515 |
| Boundary, WA |
NA |
NA |
NA |
NA |
NA |
NA |
NA |
NA |
NA |
NA |
| Danville, WA |
758 |
808 |
715 |
801 |
755 |
624 |
667 |
637 |
577 |
397 |
| Ferry, WA |
NA |
NA |
NA |
NA |
NA |
NA |
NA |
NA |
NA |
NA |
| Frontier, WA |
888 |
882 |
522 |
800 |
718 |
1,546 |
722 |
677 |
762 |
693 |
| Laurier, WA |
763 |
743 |
730 |
687 |
741 |
722 |
625 |
549 |
589 |
497 |
| Lynden, WA |
NA |
NA |
NA |
NA |
NA |
NA |
NA |
NA |
NA |
NA |
| Metaline Falls,
WA |
NA |
NA |
NA |
NA |
NA |
NA |
NA |
NA |
NA |
NA |
| Nighthawk, WA |
NA |
NA |
NA |
NA |
NA |
NA |
NA |
NA |
NA |
NA |
| Oroville, WA |
NA |
NA |
NA |
NA |
NA |
NA |
NA |
NA |
NA |
NA |
| Point Roberts,
WA |
NA |
NA |
NA |
NA |
NA |
NA |
NA |
NA |
NA |
NA |
| Sumas, WA |
4,433 |
4,224 |
4,300 |
4,008 |
4,380 |
4,392 |
4,012 |
2,920 |
2,784 |
2,920 |
| U.S. - Canada
Border Total |
278,130 |
226,796 |
213,596 |
249,106 |
245,933 |
249,172 |
269,502 |
R253,652 |
225,380 |
190,366 |
Key:
U: Data unavailable
NA: Data not applicable
Source: U.S. DOT, BTS based on data from
U.S. Customs Service, Mission Support Services, Office
of Field Operations, Operations Management Database.
|
|
|
2003 PRIVATE PASSENGER COACH STATISTICS |
| Total Moves |
226 |
111 |
69 |
43 |
59 |
64 |
99 |
161 |
139 |
154 |
100 |
133 |
| Total Miles |
114,075 |
51,649 |
19,971 |
22,481 |
24,914 |
46,422 |
80,052 |
65,881 |
82,402 |
82,846 |
36,300 |
107,876 |
| Total Revenue |
$141,361 |
$75,282 |
$27,554 |
$34,551 |
$35,846 |
$65,717 |
$113,247 |
$101,038 |
$115,877 |
$106,649 |
$53,638 |
$114,630 |
Total Moves: 1358
Total Miles: 724, 869
Total Revenue: $1,015,391
|
|
| AMTRAK 25 BUSIEST 2008 STATIONS |
| New York |
4,384,803 |
4,354,542 |
8,739,345 |
| Washington, DC |
2,258,113 |
2,231,842 |
4,489,955 |
| Philadelphia, PA |
1,984,998 |
1,983,280 |
3,968,278 |
| Chicago, IL |
1,548,101 |
1,556,050 |
3,104,151 |
| Los Angeles, CA |
787,707 |
794,657 |
1,582,364 |
| Boston, MA |
693,281 |
700,410 |
1,393,691 |
| Sacramento, CA |
578,957 |
567,351 |
1,146,308 |
| Baltimore, MD |
507,929 |
512,375 |
1,020,304 |
| San Diego, CA |
466,448 |
445,648 |
912,096 |
| Albany-Rensselaer, NY |
416,711 |
414,029 |
830,740 |
| Wilmington, DE |
364,071 |
367,468 |
731,539 |
| New Haven, |
352,130 |
353,328 |
705,458 |
| Newark, NJ |
341,619 |
337,660 |
679,279 |
| Irvine, CA |
334,958 |
334,447 |
669,405 |
| BWI Airport, MD |
320,175 |
324,465 |
644,640 |
| Seattle, WA |
313,669 |
303,398 |
617,067 |
| Providence, RI |
301,709 |
306,708 |
608,417 |
| Portland, OR |
297,858 |
300,775 |
598,633 |
| Milwaukee, WI |
284,233 |
280,776 |
565,009 |
| Emeryville, CA |
263,102 |
265,101 |
528,203 |
| Harrisburg, PA |
264,932 |
262,124 |
527,056 |
| Lancaster, PA |
242,241 |
241,861 |
484,102 |
| Davis, CA |
230,262 |
221,733 |
451,995 |
| Trenton, NJ |
225,547 |
225,543 |
543 451,090 |
| Solana Beach, CA |
231,251 |
216,830 |
448,081 |
|
|
TOTAL ACCIDENTS/INCIDENTS JANUARY-SEPTEMBER 2009 |
| 712 |
720 |
733 |
734 |
0.1 |
3.1 |
| 10,492 |
10,481 |
9,689 |
7,938 |
-18.1 |
-24.3 |
| 679 |
634 |
622 |
543 |
-12.7 |
-20.0 |
| 6,692 |
7,193 |
6,754 |
5,539 |
-18.0 |
-17.2 |
| 2,269 |
2,045 |
1,904 |
1,378 |
-27.6 |
-39.3 |
| 1 |
4 |
25 |
3 |
-88.0 |
200.0 |
| 144 |
133 |
303 |
81 |
-73.3 |
-43.8 |
| 152 |
148 |
144 |
104 |
-27.8 |
-31.6 |
| 1,651 |
1,492 |
1,378 |
979 |
-29.0 |
-40.7 |
| 466 |
405 |
382 |
295 |
-22.8 |
-36.7 |
| 792 |
721 |
647 |
477 |
-26.3 |
-39.8 |
| 806 |
773 |
684 |
468 |
-31.6 |
-41.9 |
| 268 |
250 |
264 |
188 |
-28.8 |
-29.9 |
| 41 |
33 |
38 |
35 |
-7.9 |
-14.6 |
| 362 |
268 |
271 |
210 |
-22.5 |
-42.0 |
| 1,192 |
1,068 |
1,058 |
736 |
-30.4 |
-38.3 |
| 2,165 |
2,031 |
1,787 |
1,379 |
-22.8 |
-36.3 |
| 274 |
258 |
215 |
181 |
-15.8 |
-33.9 |
| 763 |
756 |
688 |
504 |
-26.7 |
-33.9 |
| 6,058 |
6,405 |
5,998 |
5,181 |
-13.6 |
-14.5 |
| 404 |
372 |
382 |
359 |
-6.0 |
-11.1 |
| 5,785 |
6,304 |
5,763 |
4,954 |
-14.0 |
-14.4 |
| 10 |
10 |
20 |
13 |
-35.0 |
30.0 |
| 4,107 |
4,059 |
3,798 |
3,262 |
-14.1 |
-20.6 |
| 390 |
348 |
357 |
339 |
-5.0 |
-13.1 |
| 376 |
316 |
329 |
260 |
-21.0 |
-30.9 |
NOTES:
Total accidents/incidents rate is the total number of accidents/incidents
reported times 1,000,000, divided by total train miles.
Train accident rate is the number of train accidents times 1,000,000
divided by total train miles.
Yard accident rate is the number of train accidents that occurred on yard
track times 1,000,000 divided by the number of yard switching train miles.
Other track rate is the number of accidents that did not occur on yard track
times 1,000,000 divided by total train miles minus yard switching train miles.
Highway-rail incident rate is the number of incidents times 1,000,000
divided by the total number of train miles.
Employee on duty rate is the number of reported cases (fatal and nonfatal)
times 200,000 divided by the number of employee hours worked.
Trespasser rate is the number of reported cases (fatal and nonfatal),
excluding those associated with highway-rail incidents times 1,000,000
divided by the total train miles.
|
|
| ACCIDENT/INCIDENT RATE SUMMARY JANUARY-SEPTEMBER 2009 |
| 17.29 |
17.72 |
16.59 |
15.92 |
-4.04 |
-7.91 |
| 3.74 |
3.46 |
3.26 |
2.76 |
-15.2 |
-26.1 |
| 17.75 |
13.69 |
13.56 |
11.84 |
-12.7 |
-33.3 |
| 2.00 |
1.90 |
1.67 |
1.47 |
-12.0 |
-26.3 |
| 3.57 |
3.43 |
3.06 |
2.77 |
-9.62 |
-22.5 |
| 2.24 |
2.22 |
2.10 |
2.01 |
-4.25 |
-10.4 |
| 1.26 |
1.12 |
1.17 |
1.20 |
2.27 |
-4.81 |
| 5.61 |
8.75 |
7.57 |
5.56 |
-26.6 |
-1.00 |
NOTES:
Total accidents/incidents rate is the total number of accidents/incidents
reported times 1,000,000, divided by total train miles.
Train accident rate is the number of train accidents times 1,000,000
divided by total train miles.
Yard accident rate is the number of train accidents that occurred on yard
track times 1,000,000 divided by the number of yard switching train miles.
Other track rate is the number of accidents that did not occur on yard track
times 1,000,000 divided by total train miles minus yard switching train miles.
Highway-rail incident rate is the number of incidents times 1,000,000
divided by the total number of train miles.
Employee on duty rate is the number of reported cases (fatal and nonfatal)
times 200,000 divided by the number of employee hours worked.
Trespasser rate is the number of reported cases (fatal and nonfatal),
excluding those associated with highway-rail incidents times 1,000,000
divided by the total train miles.
|
|
| RAILWAY JOB PROSPECTSProjections data from the National
Employment Matrix |
Occupational title |
SOC Code |
Employment, 2006 |
Projected
employment,
2016 |
Change, 2006-16 |
Detailed statistics |
|
Number |
Percent |
|
Rail transportation occupations |
53-4000 |
125,000 |
127,000 |
1,800 |
1 |
PDF |
zipped
XLS |
|
Locomotive engineers and operators |
53-4010 |
47,000 |
48,000 |
1,300 |
3 |
PDF |
zipped
XLS |
|
Railroad brake, signal, and switch operators |
53-4021 |
25,000 |
22,000 |
-2,800 |
-11 |
PDF |
zipped
XLS |
|
Railroad conductors and yardmasters |
53-4031 |
40,000 |
44,000 |
3,600 |
9 |
PDF |
zipped
XLS |
|
Subway and streetcar operators |
53-4041 |
6,900 |
7,800 |
800 |
12 |
PDF |
zipped
XLS |
|
Rail transportation workers, all other |
53-4099 |
6,800 |
5,500 |
-1,300 |
-19 |
PDF |
zipped
XLS
|
|
|
|
| RESERVATION AND TRANSPORTATION TICKET AGENTSProjections data from the National Employment Matrix |
Occupational title |
SOC Code |
Employment, 2006 |
Projected
employment,
2016 |
Change, 2006-16 |
Detailed statistics |
|
Number |
Percent |
|
Reservation and transportation ticket agents and
travel clerks |
43-4181 |
165,000 |
167,000 |
1,800 |
1 |
PDF |
zipped
XLS
|
|
|
|
| Table: 1 POPULATION AND POPULATION DENSITIES
Europe, Japan, and the United States |
Paris |
8,548 827 10,300 |
| Lyon |
1,171 279 4,200 |
| Tokyo |
11,649 357 32,800 |
| Osaka |
2,648 98 27,100 |
| London |
6,900 621 11,100 |
| Glasgow |
763 61 12,447 |
| New York |
7,072 302 23,500 |
| Washington |
638 63 10,200 |
| Chicago |
3,005 228 13,174 |
| Detroit |
1,203 136 8,874 |
| Los Angeles |
2,967 468 6,400 |
| San Diego |
876 320 2,700 |
NOTE: Population Square population per City pairs (000s) miles square mile
SOURCE: �Far East and Australia Statistics,� 1982, Europa Publications;
�U.K.Statistical Yaarbook, 1981, by HMSO (Her Majesty�s Statistics Office);
�Whittaker�s Almanac,� 1963; �1980 Census of Population,� U.S. Department
of Commerce, PC80 Series, February 1982.
|
|
| RAILROAD CLASIFICATION |
Class I Railroads: Account for 67% of the industry�s mileage, 90% of its employees, and 93% of its freight revenue. They operate in many states and concentrate largely (but not exclusively) on long-haul, high-density intercity traffic lanes. There are seven Class I railroads: BNSF, CSX, Grand Trunk Corporation (owned by Canadian National), Kansas City Southern, Norfolk Southern, Soo Line (owned by Canadian Pacific), and Union Pacific.
Regional Railroads: Operate at least 350 miles and/or have revenue of between $40 million and the Class I threshold. There were 33 regional railroads in 2007. They typically operate 400 to 650 miles in two to four states and have 75 to 500 employees.
Local Railroads: Operate less than 350 miles and earn less than $40 million per year; the vast majority operate fewer than 75 miles in a single state and earn less than $5 million per year. There were 324 local linehaul railroads in 2007.
Switching and Terminal Railroads: Primarily provide switching and/or terminal services. Rather than point-to-point transportation, they usually perform pick up and delivery services within a specified area, or funnel traffic between other railroads. In 2007, there were 199 S&T railroads.
The overwhelming majority of U.S. freight railroads are privately-owned and operate on tracks that are owned, built, and maintained by the railroads themselves. From 1980 to 2008, railroads re-invested some $440 billion of their own funds on locomotives, freight cars, tracks, bridges, tunnels and other infrastructure. Railroads have been re-investing record amounts back into their systems, and they are committed to continuing to make the substantial investments a first class rail system requires
|
|
| RAILROADS: TRANSPORTATION BACKBONE OF AMERICA |
From one end of the country to the other, the United States is connected by the most
efficient, affordable, and environmentally-responsible freight rail system in the
world. The seven large �Class I� railroads, in conjunction with hundreds of smaller
railroads, provide world-class rail service to towns and cities throughout the country.
From the food on our tables to the cars we drive to the shoes on our children�s feet,
freight railroads carry the things America depends on. All told, railroads account for
43 percent of intercity freight volume � more than any other mode of transportation.
Nearly half of America�s electricity comes from coal, and 70 percent of coal is delivered
by rail. Railroads also safely carry enormous amounts of chemicals, plastic resins, and
fertilizers; cement, sand, and crushed stone; autos and auto parts; steel and other metal
products; lumber; paper products; and much more.
Intermodal � shipping containers and truck trailers moving on railroads � has been the
fastest growing rail traffic segment over the past 20 years, and now accounts for nearly as
much rail revenue as coal. Talk about taking trucks off the road!
Saving America Money.
Based on revenue per ton-mile (a
surrogate for rail rates), average U.S.
freight rail rates fell 49 percent
from 1981 to 2008. This means the
average shipper can ship two rail
cars for about the same price it paid
to move one 25 years ago. What
other industry can make a claim like
this?
According to World Bank data,
average U.S. freight rail rates are half
those in China and Japan, and 50 to
75 percent below those in major European countries.
Essential to a Greener, More Energy-Efficient Future
These days, every industry is looking to �go green,� but America�s freight railroads have
been �going green� for decades. In 2008, they moved a ton of freight an average of 457
miles per gallon of fuel (up from 436 miles in 2007). If just 10 percent of the longdistance
freight that moves by truck moved by rail instead, fuel savings would exceed one
billion gallons per year.
Greenhouse gas emissions are directly related to fuel consumption. That means that
moving freight by rail instead of truck reduces greenhouse gas emissions by twothirds
or more � without negatively affecting the economy.
Railroad Regulation: A Remarkable �Before and After� Story.
Railroads were the first U.S. industry subject to widespread federal economic regulation.
For nearly 100 years, Washington bureaucrats held a tight grip on rail operations.
Largely because of excessive regulation, by the 1970s U.S. freight railroads were on the
brink of ruin. Bankruptcies were common, service was poor, and tracks and equipment
were falling apart because railroads couldn�t afford the cost of upkeep. Railroads could
not provide the efficient, reliable transportation that America needed.
In 1980, Congress wisely recognized the need for change and passed the Staggers Rail
Act. Staggers ushered in a new era. Suddenly, railroads had the freedom to decide for
themselves � rather than have Washington decide for them � what routes to use, what
services to offer, and what prices to charge.
The more balanced and reasonable
regulatory environment created
by Staggers has been a great success
for rail shippers, railroads � and,
most importantly � the public at
large. Thanks to Staggers, railroad
productivity has skyrocketed � and
most of the resulting savings have
been passed on to shippers in the
form of sharply lower rail rates.
Unlike trucks, barges, and airlines,
U.S. freight railroads operate almost
exclusively on tracks they build,
maintain, and pay for themselves. From 1980 to 2008, railroads re-invested $440 billion
back into their systems to create a safe, reliable system second to none in the world.
Under Staggers, regulators retained authority to protect shippers against unreasonable
railroad conduct. Regulators still have this authority today. This ensures that freight
rail is fair and competitive, and that railroads are held accountable for their actions.
In the Future, Having Enough Rail Capacity Will Be Key.
America�s demand for safe, dependable freight transportation will skyrocket in the years
ahead. Though freight railroads are already re-investing record amounts of their own
funds back into their systems, they cannot keep up with this demand on their own.
How can policymakers help ensure that America has the rail capacity it needs? By
implementing targeted tax incentives for projects that revitalize and expand rail capacity;
by forming more partnerships with railroads; and by maintaining the existing regulatory
balance that protects shippers and consumers against anti-competitive railroad behavior
while giving railroads the freedom to operate in the competitive marketplace.
|
NOTE: Average Inflation-Adjusted U.S. Freight Railroad
Rates Are Half What They Were in 1981
NOTE: Preliminary Source AAR:
(Class I Revenue Per Ton-Mile, All Commodities)
Railroad rates are down 49% since the
Staggers Act restored reasonable
balance to railroad regulation.
NOTE: AAR Policy and Economics Department
|
|
| CURRENT AND FORMER CLASS I RAILROADSNorth
America |
Akron, Canton and Youngstown
|
Alabama Great Southern
|
Alabama, Tennessee and Northern
|
Alabama and Vicksburg
|
Alton Railroad
|
Ann Arbor Railroad
|
Arizona Eastern
|
Arizona and New Mexico
|
Atchison, Topeka and Santa Fe Railway
|
Atlanta, Birmingham and Atlantic
|
Atlanta, Birmingham and Coast
|
Atlanta and St. Andrews Bay
|
Atlanta and West Point
|
Atlantic City
|
Atlantic Coast Line
|
Atlantic and Danville
|
Atlantic and St. Lawrence
|
Auto-Train Corporation
|
Baltimore, Chesapeake and Atlantic
|
Baltimore and Ohio
|
Bangor and Aroostook
|
Beaumont, Sour Lake and Western
|
Bessemer and Lake Erie
|
Bingham and Garfield
|
BNSF Railway
|
Boston and Maine Corporation
|
Boston and Maine
|
Buffalo, Rochester-Pittsburgh
|
Buffalo and Susquehanna
|
Burlington Northern Inc.
|
Burlington Northern
|
Burlington Northern-Santa Fe
|
Burlington-Rock Island
|
Butte, Anaconda and Pacific
|
Cambria and Indiana
|
Canadian National
|
Canadian National in New England
|
Canadian Northern
|
Canadian Pacific
|
Canadian Pacific in Maine
|
Canadian Pacific Lines in Vermont
|
Carolina, Clinchfield and Ohio
|
Carolina and Northwestern
|
Central of Georgia
|
Central New England
|
Central Railroad of New Jersey
|
Central Railroad of Pennsylvania
|
Central Vermont
|
Charleston & Western Carolina
|
Chesapeake and Ohio
|
Chesapeake-Ohio of Indiana
|
Chicago and Alton
|
Chicago, Burlington and Quincy
|
Chicago, Detroit-Canada Grand Trunk Jct
|
Chicago & Eastern Illinois
|
Chicago and Erie
|
Chicago Great Western
|
Chicago & Illinois Midland
|
Chicago, Indiana & Southern
|
Chicago, Indianapolis-Louisville
|
Chicago, Milwaukee & Puget Sound
|
Chicago, Milwaukee, St Paul-Pacific
|
Chicago-North Western Transportation
|
Chicago, Peoria & St Louis
|
Chicago, Rock Island & Gulf
|
Chicago, Rock Island-Pacific
|
Chicago, St Paul, Minneapolis, Omaha
|
Chicago Southern
|
Chicago, Terre Haute-Southeastern
|
Cincinnati, Hamilton & Dayton
|
Cincinnati, Indianapolis-Western
|
Cincinnati, Lebanon & Northern
|
Cincinnati, New Orleans-Texas Pacific
|
Cincinnati Northern
|
Cleveland, Akron & Cincinnati
|
Cleveland, Akron & Columbus
|
Cleveland, Cincinnati, Chicago, St Louis
|
Clinchfield
|
Coal and Coke
|
Colorado Midland
|
Colorado Midland
|
Colorado & Southern
|
Colorado & Wyoming
|
Columbus & Greenville
|
Columbus & Greenville
|
Consolidated Rail Corporation
|
Copper River & Northwestern
|
Cripple Creek-Colorado Springs
|
CSX Transportation
|
Cumberland Valley
|
Cumberland Valley-Martinsburg
|
Delaware & Hudson Company
|
Delaware & Hudson
|
Delaware & Hudson
|
Delaware,Lackawanna-Western
|
Denver, Northwestern-Pacific
|
Denver & Rio Grande
|
Denver-Rio Grande Western
|
Denver & Salt Lake
|
Denver & Salt Lake Railway
|
Detroit,Grand Haven-Milwaukee
|
Detroit & Mackinac
|
Detroit, Toledo & Ironton
|
Detroit, Toledo & Ironton
|
Detroit& Toledo Shore Line
|
Duluth & Iron Range
|
Duluth, Missabe & Iron Range
|
Duluth, Missabe and Northern
|
Duluth, South Shore-Atlantic
|
Duluth, Winnipeg and Pacific
|
El Paso and Southwestern
|
Elgin, Joliet and Eastern
|
Erie
|
Erie-Lackawanna
|
Erie Lackawanna
|
Evansville, Indianapolis-Terre Haute
|
Evansville and Terre Haute
|
Florence & Cripple Creek
|
Florida East Coast
|
Fonda, Johnstown-Gloversville
|
Fort Smith and Western
|
Fort Smith and Western
|
Fort Worth and Denver
|
Fort Worth-Denver City
|
Fort Worth and Rio Grande
|
Galveston, Harrisburg-San Antonio
|
Georgia
|
Georgia and Florida
|
Georgia and Florida
|
Georgia Southern-Florida
|
Grand Canyon
|
Grand Rapids and Indiana
|
Grand Trunk Corporation
|
Grand Trunk Western
|
Grand Trunk Western
|
Great Northern
|
Green Bay and Western
|
Gulf, Colorado-Santa Fe
|
Gulf, Mobile and Northern
|
Gulf, Mobile and Ohio
|
Gulf and Ship Island
|
Hocking Valley
|
Houston East and West Texas
|
Houston and Texas Central
|
Illinois Central
|
Illinois Central Gulf
|
Illinois Terminal Company
|
Illinois Terminal
|
Indianapolis Southern
|
International-Great Northern
|
International-Great Northern
|
International-Great Northern
|
International Railway of Maine
|
Iowa Central
|
Kanawha and Michigan
|
Kansas City, Mexico-Orient
|
Kansas City, Mexico-Orient
|
Kansas City, Mexico-Orient of Texas
|
Kansas City Southern
|
Kansas, Oklahoma-Gulf
|
Lake Erie and Western
|
Lake Shore-Michigan Southern
|
Lake Superior and Ishpeming
|
Lake Superior and Ishpeming
|
Lehigh and Hudson River
|
Lehigh and New England
|
Lehigh Valley
|
Litchfield and Madison
|
Long Island
|
Los Angeles-Salt Lake
|
Louisiana and Arkansas
|
Louisiana, Arkansas-Texas
|
Louisiana Railway-Navigation
|
Louisiana & Navigation of Texas
|
Louisiana Western
|
Louisville, Henderson-St Louis
|
Louisville and Nashville
|
Maine Central
|
Maryland, Delaware-Virginia
|
Michigan Central
|
Michigan Interstate
|
Midland Valley
|
Mineral Range
|
Minneapolis, Northfield-Southern
|
Minneapolis and St Louis
|
Minneapolis and St Louis
|
Minneapolis, St Paul-Sault St Marie
|
Minneapolis, St Paul-Sault St Marie
|
Minnesota and International
|
Mississippi Central
|
Missouri and Arkansas
|
Missouri-Illinois
|
Missouri-Kansas-Texas
|
Missouri, Kansas and Texas
|
Missouri-Kansas-Texas of Texas
|
Missouri, Kansas-Texas of Texas
|
Missouri and North Arkansas
|
Missouri and North Arkansas
|
Missouri, Oklahoma-Gulf
|
Missouri Pacific
|
Missouri Pacific
|
Mobile and Ohio
|
Monon Railroad Monongahela
|
Monongahela
|
Montour
|
Louisiana-Texas Steamship Co
|
Nashville, Chattanooga-St Louis
|
Nevada Northern
|
New Jersey and New York
|
New Orleans Great Northern
|
New Orleans, Mobile-Chicago
|
New Orleans-Northeastern
|
New Orleans, Texas-Mexico
|
New Orleans, Texas-Mexico
|
New York Central
|
New York Central-Hudson River
|
New York, Chicago-St. Louis
|
New York Connecting
|
New York, New Haven-Hartford
|
New York, Ontario-Western
|
New York, Philadelphia-Norfolk
|
New York, Susquehanna-Western
|
Norfolk Southern
|
Norfolk and Western
|
Northern Alabama
|
Northern Central
|
Northern Pacific
|
Northwestern Pacific
|
Oahu Railway and Land Company
|
Oklahoma City-Ada-Atoka
|
Oregon Electric
|
Oregon Railroad and Navigation
|
Oregon Shortline
|
Oregon-Washington RR and Navigation
|
Pacific Electric
|
Panhandle and Santa Fe
|
Pecos and Northern Texas
|
Penn Central Transportation
|
Pennsylvania
|
Pennsylvania Company
|
Pennsylvania-Reading Seashore Lines
|
Peoria and Eastern
|
Pere Marquette
|
Pere Marquette
|
Perkiomen
|
Philadelphia, Baltimore and Washington
|
Philadelphia and Reading
|
Piedmont and Northern
|
Pittsburgh, Cincinnati, Chicago-St Louis
|
Pittsburgh and Lake Erie
|
Pittsburg and Shawmut Railroad
|
Pittsburg, Shawmut and Northern
|
Pittsburgh and West Virginia
|
Port Reading
|
Quanah, Acme and Pacific
|
Quincy, Omaha and Kansas City
|
Reading Company
|
Richmond, Fredericksburg and Potomac
|
Rutland
|
Sacramento Northern
|
St Joseph and Grand Island
|
St Louis, Brownsville and Mexico
|
St Louis, Iron Mountain & Southern
|
St Louis-San Francisco
|
St Louis, San Francisco & Texas
|
St Louis Southwestern
|
St Louis Southwestern of Texas
|
San Antonio and Aransas Pass
|
San Antonio, Uvalde and Gulf
|
San Diego and Arizona
|
San Diego and Arizona Eastern
|
San Pedro, Los Angeles and Salt Lake
|
Santa Fe, Prescott and Phoenix
|
Savannah and Atlanta
|
Seaboard Air Line
|
Seaboard Coast Line
|
Seaboard System
|
Seattle Northcoast & Pt Towsend
|
Soo Line
|
Southern Indiana
|
Southern Kansas of Texas
|
Southern Pacific Company
|
Southern Pacific Transportation Co
|
Southern
|
Southern Railway in Mississippi
|
Spokane and Inland Empire
|
Spokane International
|
Spokane, Portland and Seattle
|
Staten Island Rapid Transit
|
Sunset
|
Syracuse, Binghamton and NY
|
Tacoma Rail
|
Tennessee Central
|
Texarkana and Fort Smith
|
Texas Mexican
|
Texas and New Orleans
|
Texas and Northern
|
Texas and Pacific
|
Toledo and Ohio Central
|
Toledo, Peoria and Western
|
Toledo, St Louis and Western
|
Trinity and Brazos Valley
|
Ulster and Delaware
|
Union Pacific
|
Utah
|
Vandalia
|
VIA Rail Canada
|
Vicksburg, Shreveport-Pacific
|
Virginia and Southwestern
|
Virginian
|
Wabash
|
Wabash Pittsburgh Terminal
|
Washington Southern
|
West Jersey and Seashore
|
Western of Alabama
|
Western Maryland
|
Western Pacific
|
Wheeling and Lake Erie
|
Wheeling and Lake Erie
|
Wichita Falls and Northwestern
|
Wichita Falls and Southern
|
Wichita Valley
|
Wisconsin Central
|
Wisconsin Central
|
Yazoo and Mississippi Valley Railroad
|
National Rail Passenger Corporation
|
Kansas City Southern De Mexico
|
Ferrocrril Mexicano-Ferromex
|
CSX Corporation
|
|
Note:Current Railroad
|
|
|
BTS Rail Profile Financial Class I: 1960-1998 |
| Total Operating Revenues* |
$9,514 |
$11,992 |
$28,370 |
$30,809 |
$32,280 |
$32,693 |
$33,118 |
$33,151 |
$33,521 |
| Passenger |
$640 |
$421 |
$446 |
$94 |
$88 |
$89 |
$59 |
$60 |
$61 |
| Freight |
$8,025 |
$10,922 |
$26,350 |
$27,471 |
$29,931 |
$31,356 |
$31,889 |
$32,322 |
$32,247 |
| Other |
$849 |
$649 |
$1,462 |
$805 |
$790 |
$835 |
$745 |
$736 |
$843 |
| Operating Expenses* |
$8,775 |
$11,478 |
$26,355 |
$24,652 |
$25,511 |
$27,897 |
$26,331 |
$27,291 |
$27,916 |
| AMTRAK |
|
|
|
|
|
|
|
|
|
| Total Revenue* |
N |
$162 |
$429 |
$1,308 |
$1,413 |
$1,490 |
$1,550 |
$1,669 |
$2,244 |
| Total Expenses* |
N |
$301 |
$1,103 |
$2,012 |
$2,246 |
$2,257 |
$2,258 |
$2,359 |
$2,548 |
Note: Data in Milloins*, Thousands**, N = data do not exist; R = revised.
a Excluding Amtrak and all non-Class I railroads, except for Section IV.
c Data for 2003 indicates operating revenues and expenses instead of total revenues and expenses, the data source has changed.
f Amtrak data in this column are for 1972, Amtrak's first full year of operation.
NOTE Amtrak figures are based on Amtrak fiscal year (October 1-September 30).
SOURCES
1 Association of American Railroads, Railroad Facts 2006 (Washington, DC: 2004), pp. 3, 9, 10, 27, 33, 34, 36, 40, 49, 52, 77 and similar pages in earlier issues.
2 1970-2006: Amtrak, National Railroad Passenger Corporation Annual Report, Statistical Appendix to Amtrak Annual Report, Annual issues.
|
|
|
BTS Rail Profile Financial Class I: 1999-2006 |
| Total Operating Revenues |
$33,521 |
$34,102 |
$34,576 |
$35,327 |
$36,639 |
$40,517 |
$46,118 |
$52,152 |
| Passenger |
$61 |
$62 |
$62 |
$61 |
$62 |
$63 |
$65 |
$70 |
| Freight |
$32,680 |
$33,083 |
$33,533 |
$34,110 |
$35,413 |
$39131 |
$44,457 |
$50,315 |
| Other |
$780 |
$957 |
$981 |
$1,155 |
$1,164 |
$1323 |
$1,597 |
$1,767 |
| Operating Expenses |
$28,011 |
$29,040 |
$29,164 |
$29,592 |
$31,440 |
$35,107 |
$37,843 |
$40,980 |
| AMTRAK |
|
|
|
|
|
|
|
|
| Total Revenue |
$2,011 |
$2,111 |
$2,109 |
$2,228 |
$1,994-R |
$1,865R |
$1,886 |
$2,042 |
| Total Expenses |
$2,660 |
$2,876 |
$3,288 |
$3,224 |
$3,100-R |
$2,950R |
$2,940 |
$3,005 |
Note: Data in Milloins*, Thousands**, N = data do not exist; R = revised.
a Excluding Amtrak and all non-Class I railroads, except for Section IV.
c Data for 2003 indicates operating revenues and expenses instead of total revenues and expenses, the data source has changed.
NOTE Amtrak figures are based on Amtrak fiscal year (October 1-September 30).
SOURCES
1 Association of American Railroads, Railroad Facts 2006 (Washington, DC: 2004), pp. 3, 9, 10, 27, 33, 34, 36, 40, 49, 52, 77 and similar pages in earlier issues.
2 1970-2006: Amtrak, National Railroad Passenger Corporation Annual Report, Statistical Appendix to Amtrak Annual Report, Annual issues.
|
|
|
BTS Rail Profile Inventory Class I: 1960-1998 |
| Total Vehicles |
1,994,517R |
1,811,258 |
1,738,921R |
1,231,096R |
1,210,917R |
1,237,739R |
1,259,842R |
1,290,103R |
1,335,928 |
| Class I Freight Cars |
1,658,292 |
1,423,921 |
1,168,114 |
658,902 |
590,930 |
583,486 |
570,865 |
568,493 |
575,604 |
| Non-Class I Freight Cars |
307,194 |
360,260 |
542,713 |
553,359 |
601,482 |
635,441 |
669,708 |
701,926 |
740,063 |
| Locomotives |
29,031 |
27,077 |
28,094 |
18,835 |
18,505 |
18,812 |
19,269 |
19,684 |
20,261 |
| Total Companies |
106 |
71 |
38 |
14 |
12 |
11 |
10 |
9 |
9 |
| Total Employees |
780,494 |
566,282 |
458,994 |
216,424 |
189,962 |
188,215 |
181,809 |
177,981 |
178,222 |
| Total Railway Miles |
207,334 |
196,479 |
164,822 |
119,758 |
109,332 |
108,264 |
105,779 |
102,128 |
100,570 |
| AMTRAK |
|
|
|
|
|
|
|
|
|
| Railcars |
N |
1,569 |
2,128 |
1,863 |
1,852 |
1,722 |
1,730 |
1,728 |
1,962 |
| Locomotives |
N |
185 |
419 |
318 |
338 |
313 |
299 |
332 |
345 |
| Total Employees |
N |
1,500 |
21,416 |
24,000 |
25,049 |
23,646 |
23,278 |
23,555 |
24,528 |
| Total Route Miles |
N |
N |
24,000 |
24,000 |
25,000 |
24,000 |
25,000 |
25,000 |
22,000 |
Note: Data in Milloins*, Thousands**, R = revised.
a Excluding Amtrak and all non-Class I railroads, except for Section IV.
f Amtrak data in this column are for 1972, Amtrak's first full year of operation.
NOTE Amtrak figures are based on Amtrak fiscal year (October 1-September 30).
SOURCES
1 Association of American Railroads, Railroad Facts 2006 (Washington, DC: 2004), pp. 3, 9, 10, 27, 33, 34, 36, 40, 49, 52, 77 and similar pages in earlier issues.
3 1970-80: Amtrak, National Railroad Passenger Corporation Annual Report,1972, 1980, 1990, and 1993-95. 1990-2000: Ibid., National Railroad Passenger Corporation Annual Report, Statistical Appendix to Amtrak Annual Report, Annual issues. 2001-05: Association of American Railroads, Railroad Facts 2006 (Washington, DC, 2006), p.77.
4 1970-90: Amtrak, Public Affairs, personal communication. 1994-1997: Ibid., National Railroad Passenger Corporation Annual Report,1972, 1980, 1990, and 1993-95. 1998-2005: Association of American Railroads, Railroad Facts 2006 (Washington, DC: 2006), p. 77 and similar pages in earlier issues.
5 1980-90: Amtrak, Route Miles by Railroad, Corp. Planning & Development. 1994-2001: Amtrak, National Railroad Passenger Corporation Annual Report, Statistical Appendix to Amtrak Annual Report, Annual issues. 2002-05: Association of American Railroads, Railroad Facts 2006 (Washington, DC, 2006), p. 77.
|
|
|
BTS Rail Profile Inventory Class I: 1999-2006 |
| Total Vehicles |
1,389,092-R |
1,400,824-R |
1,333,881-R |
1,320,176-R |
1,299,751-R |
1,309,935-R |
1,335,024 |
1,370,239 |
| Class I Freight Cars |
579,140 |
560,154 |
499,860 |
477,751 |
467,063 |
473,773 |
474,839 |
475,415 |
| Non-Class I Freight Cars |
789,696 |
820,642 |
814,276 |
821,919 |
811,917 |
814,147 |
837,406 |
871,092 |
| Locomotives |
20,256 |
20,028 |
19,745 |
20,506 |
20,771 |
22,015 |
22,779 |
23,732 |
| Total Companies |
9 |
8 |
8 |
7 |
7 |
7 |
7 |
7 |
| Total Personnel |
177,557 |
168,360 |
162,155 |
157,372 |
154,652 |
157,699 |
162,438 |
167,581 |
| Total Railway Miles |
99,430 |
99,250 |
97,817-R |
100,125-R |
99,126-R |
97,662-R |
95,830 |
94,614 |
| AMTRAK |
|
|
|
|
|
|
|
|
|
| Railcars |
1,992 |
1,894 |
2,084 |
2,896 |
1,623 |
1,211 |
1,186 |
1,191 |
| Locomotives |
329 |
378 |
401 |
372 |
442 |
276 |
258 |
319 |
| Total Personnel |
25,291 |
25,624 |
27,316 |
22,649 |
20,905 |
20,938 |
19,234 |
18,659 |
| Total Route Miles |
23,000 |
23,000 |
23,000 |
23,000 |
22,675 |
22,256 |
22,007 |
21,708 |
Note: Data in Milloins*, Thousands**, R = revised.
a Excluding Amtrak and all non-Class I railroads, except for Section IV.
NOTE Amtrak figures are based on Amtrak fiscal year (October 1-September 30).
SOURCES
1 Association of American Railroads, Railroad Facts 2006 (Washington, DC: 2004), pp. 3, 9, 10, 27, 33, 34, 36, 40, 49, 52, 77 and similar pages in earlier issues.
3 1970-80: Amtrak, National Railroad Passenger Corporation Annual Report,1972, 1980, 1990, and 1993-95. 1990-2000: Ibid., National Railroad Passenger Corporation Annual Report, Statistical Appendix to Amtrak Annual Report, Annual issues. 2001-05: Association of American Railroads, Railroad Facts 2006 (Washington, DC, 2006), p.77.
4 1970-90: Amtrak, Public Affairs, personal communication. 1994-1997: Ibid., National Railroad Passenger Corporation Annual Report,1972, 1980, 1990, and 1993-95. 1998-2005: Association of American Railroads, Railroad Facts 2006 (Washington, DC: 2006), p. 77 and similar pages in earlier issues.
5 1980-90: Amtrak, Route Miles by Railroad, Corp. Planning & Development. 1994-2001: Amtrak, National Railroad Passenger Corporation Annual Report, Statistical Appendix to Amtrak Annual Report, Annual issues. 2002-05: Association of American Railroads, Railroad Facts 2006 (Washington, DC, 2006), p. 77.
|
|
|
BTS Rail Profile Performance Class I 1960-1998 |
| Freight Car Mileage**-1 |
28,170,000 |
29,890,000 |
29,277,000 |
26,159,000 |
28,485,000 |
30,383,000 |
31,715,000 |
31,660,000 |
32,657,000 |
| Freightr Train Mileage**-1 |
404,464 |
427,065 |
428,498 |
379,582 |
440,896 |
458,271 |
468,792 |
474,954 |
474,947 |
| Total Locomotive Mileage**-6 |
N |
N |
1,531,050 |
1,280,365 |
1,404,706 |
1,444,691 |
1,465,149 |
1,423,229 |
1,439,703 |
| Freight |
421,900 |
1,278,200 |
1,319,010 |
1,144,559 |
1,261,482 |
1,293,851 |
1,311,351 |
1,281,768 |
1,285,706 |
| Train-Yard Switching |
N |
N |
212,040 |
135,806 |
143,224 |
150,840 |
153,798 |
141,461 |
153,997 |
| Freight Revenue Ton-Miles*-1 |
572,309 |
764,809 |
918,958 |
1,033,969 |
1,200,701 |
1,305,688 |
1,355,975 |
1,348,926 |
1,376,802 |
| Freight Average Haul-Miles-1 |
461 |
515 |
616 |
726 |
817 |
843 |
842 |
851 |
835 |
| Freuight Fuel Gallon*-Consumed-1 |
3,463 |
3,545 |
3,904 |
3,115 |
3,334 |
3,480 |
3,579 |
3,575 |
3,583 |
| AVERAGE MILES TRAVELED PER VEHICLE |
|
|
|
|
|
|
|
|
|
| Car |
14,124 |
16,502 |
16,836 |
21,249 |
23,523 |
24,547 |
25,174 |
24,541 |
24,445 |
| Locomotive |
N |
N |
54,497 |
67,978 |
75,910 |
76,796 |
76,037 |
72,304 |
71,058 |
| AVERAGE MILES TRAVELED PER GALLON |
|
|
|
|
|
|
|
|
|
| Car |
8.13 |
8.43 |
7.50 |
8.40 |
8.54 |
8.73 |
8.86 |
8.86 |
9.11 |
| Train |
0.12 |
0.12 |
0.11 |
0.12 |
0.13 |
0.13 |
0.13 |
0.13 |
0.13 |
| AMTRAK |
|
|
|
|
|
|
|
|
|
| Passenger train Car-Miles*-7 |
N |
213 |
235 |
301 |
304 |
292 |
276 |
288 |
312 |
| Passenger Train-Miles*-2 |
N |
26 |
30 |
33 |
34 |
32 |
30 |
32 |
33 |
| Passenger Locomotive-Miles*-2 |
N |
N |
41 |
49 |
51 |
48 |
U |
U |
U |
| Revenue Passengers* Carried-2 |
N |
17 |
21 |
22 |
21 |
21 |
20 |
20 |
21 |
| Revenue Passenger-Miles*-2 |
N |
3,039 |
4,503 |
6,057 |
5,921 |
5,545 |
5,050 |
5,166 |
5,304 |
| Average Passenger $-Fare-2 |
N |
8.30 |
17.72 |
38.50 |
39.10 |
39.92 |
43.31 |
45.26 |
44.75 |
| Average Passenger Revenue Cent-Mile-2 |
N |
4.5 |
8.2 |
14.1 |
14.0 |
14.9 |
16.9 |
17.7 |
17.8 |
| Average Passenger Trip Miles-2 |
N |
182.6 |
217.0 |
273.0 |
279.3 |
267.9 |
256.3 |
255.7 |
251.4 |
| LOCOMOTIVE FUEL CONSUMED-8 |
|
|
|
|
|
|
|
|
|
| Diesel Gallons* |
N |
N |
64 |
82 |
75 |
66 |
71 |
75 |
75 |
| Electric* kWh |
N |
N |
254 |
330 |
309 |
304 |
293 |
282 |
275 |
Note; Data in Milloins*, Thousands** kWh = kilowatt-hour; N = data do not exist; R = revised; U = data are not available.
f Amtrak data in this column are for 1972, Amtrak's first full year of operation.
NOTE Amtrak figures are based on Amtrak fiscal year (October 1-September 30).
SOURCES
1 Association of American Railroads, Railroad Facts 2006 (Washington, DC: 2004), pp. 3, 9, 10, 27, 33, 34, 36, 40, 49, 52, 77 and similar pages in earlier issues.
2 1970-2006: Amtrak, National Railroad Passenger Corporation Annual Report, Statistical Appendix to Amtrak Annual Report, Annual issues.
6 1980-2001: Association of American Railroads, Analysis of Class 1 Railroads (Washington, DC: Annual issues). 2002-04: Ibid., Railroad Ten-Year Trends (Washington, DC: 2005), pp. 119 and 121,personal communication, Feb. 16,2005.
7 1970-90: Amtrak, Train Information System Reports. 1994-99: Amtrak Corporate Reporting, Route Profitability System, Washington DC, personal communication, August 2001. 2000-05: Association of American Railroads, Railroad Facts 2006 (Washington, DC: 2006), p. 77 and similar pages in earlier issues.
|
|
|
BTS Rail Profile Performance Class I 1999-2006 |
| Freight Car Mileage**-1 |
33,851,000 |
34,590,000 |
34,243,000 |
34,680,000 |
35,555,000 |
37,071,000 |
37,712,000 |
38,955,000 |
| Freight Train Mileage**-1 |
490,442 |
504,001 |
499,546 |
499,668 |
515,999 |
534,696 |
547,566 |
562,607 |
| Total Locomotive Mileage**-6 |
1,503,947 |
1,502,819 |
1,477,546 |
1,443,531 |
1,484,074 |
1,538,385 |
U |
U |
| Freight |
1,349,580 |
1,354,590 |
1,327,669 |
1,300,574 |
1,353,885 |
1,398,450 |
U |
U |
| Train-Yard Switching |
154,367 |
148,229 |
149,876 |
142,957 |
130,190 |
139,935 |
U |
U |
| Freight Revenue Ton-Miles*-1 |
1,433,461 |
1,465,960 |
1,495,472 |
1,507,011 |
1,551,438 |
1,662,598 |
1,696,425 |
1,771,897 |
| Average Freight haul-Miles-1 |
835 |
843 |
859 |
853 |
862 |
902 |
894 |
906 |
| Freight Fuel-Gallons* Consumed-1 |
3,715 |
3,700 |
3,710 |
3,730 |
3,826 |
4,059 |
4,098 |
4,192 |
| AVERAGE MILES TRAVELED PER VEHICLE |
|
|
|
|
|
|
|
|
| Car |
24,369 |
24,693 |
25,672 |
26,269 |
27,355 |
28,300 |
28,248 |
28,429 |
| Locomotive |
74,247 |
75,036 |
74,831 |
70,396 |
71,449 |
69,879 |
U |
U |
| AVERAGE MILES TRAVELED PER GALLON |
|
|
|
|
|
|
|
|
| Car |
9.11 |
9.35 |
9.23 |
9.30 |
9.29 |
9.13 |
9.20 |
9.29 |
| Train |
0.13 |
0.14 |
0.13 |
0.13 |
0.13 |
0.13 |
0.13 |
0.13 |
| AMTRAK |
|
|
|
|
|
|
|
|
| Passenger Train Car Miles*-7 |
342 |
371 |
378 |
379 |
332 |
308 |
265 |
264 |
| Passenger Train Miles*-2 |
34 |
35 |
36 |
38 |
37 |
37 |
36 |
36 |
| Passenger Locomotive Miles*-2 |
U |
U |
U |
U |
U |
U |
U |
U |
| Revenue* Passengers Carried-2 |
22 |
23 |
24 |
23 |
25 |
25 |
25 |
25 |
| Revenue* Passenger-Miles-2 |
5,330 |
5,498 |
5,559 |
5,314 |
5,680 |
5,511 |
5,381 |
5,410 |
| Average Passenger $-Fare-2- |
46.85 |
49.61 |
51.58 |
56.05 |
57.78 |
56.81 |
58.29 |
65.43 |
| Average Passenger Revenue Cent-Mile-2 |
18.9 |
20.3 |
21.8 |
24.5 |
25.0 |
26.0 |
27.16 |
29.69 |
| Average Passenger Trip Miles-2 |
247.9 |
244.4 |
236.6 |
228.4 |
230.9 |
218.6 |
214.6 |
220.4 |
| LOCOMOTIVE FUEL CONSUMED-8 |
|
|
|
|
|
|
|
|
| Diesel Gallons* |
74 |
76 |
75 |
86 |
78 |
70 |
68 |
U |
| Electric kWh* |
283 |
350 |
377 |
593 |
666 |
648 |
500 |
U |
Note; Data in Milloins*, Thousands** kWh = kilowatt-hour; N = data do not exist; R = revised; U = data are not available.
NOTE Amtrak figures are based on Amtrak fiscal year (October 1-September 30).
SOURCES
1 Association of American Railroads, Railroad Facts 2006 (Washington, DC: 2004), pp. 3, 9, 10, 27, 33, 34, 36, 40, 49, 52, 77 and similar pages in earlier issues.
2 1970-2006: Amtrak, National Railroad Passenger Corporation Annual Report, Statistical Appendix to Amtrak Annual Report, Annual issues.
6 1980-2001: Association of American Railroads, Analysis of Class 1 Railroads (Washington, DC: Annual issues). 2002-04: Ibid., Railroad Ten-Year Trends (Washington, DC: 2005), pp. 119 and 121,personal communication, Feb. 16,2005.
7 1970-90: Amtrak, Train Information System Reports. 1994-99: Amtrak Corporate Reporting, Route Profitability System, Washington DC, personal communication, August 2001. 2000-05: Association of American Railroads, Railroad Facts 2006 (Washington, DC: 2006), p. 77 and similar pages in earlier issues.
|
|
|
|
BTS Rail Profile Safety-d,9 Class I: 1960-1998 |
| Total Fatalities |
2,345 |
2,331 |
1,424 |
1,300 |
1,226 |
1,146 |
1,039 |
1,063 |
1,008 |
| Passengers On Trains |
34 |
10 |
4 |
3 |
5 |
0 |
12 |
6 |
4 |
| Personnel On Duty |
215 |
179 |
97 |
40 |
31 |
34 |
33 |
37 |
27 |
| Personnel Not On Duty |
N |
N |
4 |
0 |
0 |
2 |
0 |
0 |
2 |
| Trespassers |
637 |
607 |
566 |
700 |
682 |
660 |
620 |
646 |
644 |
| Nont-Trespassers |
1,459 |
1,535 |
746 |
554 |
505 |
443 |
365 |
363 |
326 |
| Contractor Personnel |
N |
N |
7 |
3 |
3 |
7 |
9 |
11 |
5 |
| Grade Crossing |
1,421 |
1,440 |
772 |
698 |
615 |
579 |
488 |
461 |
431 |
| Railroad-e |
924 |
785 |
645 |
599 |
611 |
567 |
551 |
602 |
577 |
Note: Data in Milloins*, Thousands**, N = data do not exist; R = revised.
d Safety figures from U.S. Department of Transportation, Federal Railroad Administration are for all railroads.
e Figures may not appear directly in data source.
f Amtrak data in this column are for 1972, Amtrak's first full year of operation.
NOTE: Amtrak figures are based on Amtrak fiscal year (October 1-September 30). SOURCES
9 1960-80: U.S. Department of Transportation, Federal Railroad Administration, Systems
Support Division, RRS-22, personal communication. 1990-94: Ibid., Accident / Incident Bulletin(Washington, DC: Annual issues), tables 7 and 9. 1995-2005: Ibid., Interim Railroad Safety Statistics, Annual Report 2005 (Washington, DC: 2005), table 1-3, and similar tables in earlier editions. 2006: Ibid, Office of Safety Analysis, table 4.08, at:FRA Safety Data
as of Dec. 12, 2007.
| |
|
BTS Rail Profile Safety Class-d,9 I: 1999-2006 |
| Total Fatalities |
932 |
937 |
971 |
951 |
868-R |
895-R |
887 |
910 |
| Passengers On Trains |
14 |
4 |
3 |
7 |
3 |
3 |
16 |
2 |
| Personnel On Duty |
31 |
24 |
22 |
20 |
19 |
25 |
25 |
16 |
| Personnel Not On Duty |
0 |
1 |
0 |
1 |
1 |
0 |
0 |
0 |
| Trespassers |
570 |
570 |
673 |
646 |
634 |
621-R |
600 |
665 |
| Non-Trespassers |
305 |
335-R |
269 |
267-R |
206-R |
242-R |
241 |
220 |
| Contractor Personnel |
12 |
3 |
4 |
10 |
5 |
4 |
5 |
7 |
| Grade Crossing |
402 |
425 |
421 |
357 |
334 |
372-R |
358 |
369 |
| Railroad-e |
530 |
512 |
550 |
594 |
534-R |
523-R |
529 |
541 |
Note: Data in Milloins*, Thousands**, N = data do not exist; R = revised.
d Safety figures from U.S. Department of Transportation, Federal Railroad Administration are for all railroads.
e Figures may not appear directly in data source.
NOTE: Amtrak figures are based on Amtrak fiscal year (October 1-September 30). SOURCES
9 1960-80: U.S. Department of Transportation, Federal Railroad Administration, Systems
Support Division, RRS-22, personal communication. 1990-94: Ibid., Accident / Incident Bulletin(Washington, DC: Annual issues), tables 7 and 9. 1995-2005: Ibid., Interim Railroad Safety Statistics, Annual Report 2005 (Washington, DC: 2005), table 1-3, and similar tables in earlier editions. 2006: Ibid, Office of Safety Analysis, table 4.08, at:FRA Safety Data
as of Dec. 12, 2007.
|
|
| NORTH AMERICAN FREIGHT CARS IN SERVICES
January 1, 2007 |
| Canada |
183,593 |
146,547 |
6,268 |
30,778 |
| Mexico |
33,650 |
22,280 |
5,552 |
5,818 |
| United States |
1,346,507 |
475,415 |
120,688 |
750,404 |
| Totals |
1,563,750 |
644,242 |
132,508 |
787,000 |
|
|
NOTE: * For Canada and Mexico, "Class I" railroads exceed the revenue threshold and would be Class I
railroads if they were U.S. railroads.
Canadian-owned U.S. railroads are included in the Canadian figures.
Some railroads may possess additional freight cars that are unregistered.
Copyright � 2008, Association of American Railroads.
|
|
|
TABLE 3-4-2: AMTRAK FLEET AGE OF LOCOMOTIVES-COACHES FISCAL YEARS: 1995�2007 |
| 1995 |
13.9 |
21.8 |
| 1996 |
14.4 |
20.7 |
| 1997 |
12.0 |
19.8 |
| 1998 |
12.6 |
21.1 |
| 1999 |
12.8 |
22.2 |
| 2000 |
11.2 |
19.4 |
| 2001 |
13.9 |
18.5 |
| 2002 |
13.7 |
20.4 |
| 2003 |
14.8 |
21.4 |
| 2004 |
15.7 |
22.4 |
| 2005 |
16.4 |
23.3 |
| 2006 |
17.5 |
22.5 |
| 2007 |
18.5 |
22.2 |
NOTE: Roadrailers are not considered rolling stock for the purpose of these calculations.
SOURCE: National Railroad Passenger Corporation (Amtrak), personal communication as of August 2008 as reported in U.S. Department of Transportation, Research and Innovative Technology Administration, Bureau of Transportation Statistics,National Transportation Statistics, table 1-30, available as of October 2008.
|
|
| BTS TABLE: 1-7 STATIONS SERVED BY AMTRAK AND RAIL TRANSITFiscal Year: 1984-1995 |
| Amtrak |
510 |
503 |
491 |
487 |
498 |
504 |
516 |
523 |
524 |
535 |
540 |
530 |
| Rail Transit |
1,822 |
1,895 |
1,920 |
2,164 |
2,027 |
2,143 |
2,169 |
2,192 |
2,240 |
2,286 |
2,376 |
2,282 |
NOTE: U = data are not available.
U.S. Department of Transportation, Federal Transit Administration, National Transit Database 2006 (Washington, DC: 2008), table 21 and similar tables in earlier editions.
Rail transit is the sum of commuter rail, heavy rail, and light rail. In several large urban areas, Amtrak and commuter rail stations are shared. Starting in 2001 stations serving the Alaska Railroad are included in the rail transit total.
Rail transit data for 2002 and later years include service both directly operated and purchased. Prior to 2002, data only include directly operated service.
NOTE:
1984-2002: Amtrak, Amtrak Annual Report , Statistical Appendix (Washington, DC: Annual issues).
2003-04: Ibid., State Fact Sheets , Amtrak as of Nov. 11, 2005.
2005: Ibid., State Fact Sheets , Amtrak as of Mar. 22, 2006.
|
|
| BTS TABLE: 1-7 STATIONS SERVED BY AMTRAK AND RAIL TRANSITFiscal Year: 1996-2007 |
| Amtrak |
542 |
516 |
508 |
510 |
515 |
512 |
515 |
526 |
526 |
527 |
505 |
518 |
| Rail Transit |
2,325 |
2,391 |
2,524 |
2,567 |
2,595 |
2,621 |
2,784 |
2797 |
2,909 |
2,936 |
2,975 |
U |
NOTE: U = data are not available.
U.S. Department of Transportation, Federal Transit Administration, National Transit Database 2006 (Washington, DC: 2008), table 21 and similar tables in earlier editions.
Rail transit is the sum of commuter rail, heavy rail, and light rail. In several large urban areas, Amtrak and commuter rail stations are shared. Starting in 2001 stations serving the Alaska Railroad are included in the rail transit total.
Rail transit data for 2002 and later years include service both directly operated and purchased. Prior to 2002, data only include directly operated service.
NOTE:
1984-2002: Amtrak, Amtrak Annual Report , Statistical Appendix (Washington, DC: Annual issues).
2003-04: Ibid., State Fact Sheets , Amtrak as of Nov. 11, 2005.
2005: Ibid., State Fact Sheets , Amtrak as of Mar. 22, 2006.
|
|
| WORLDWIDE PAID VACATIONS |
Italy |
42 days |
| France |
37 days |
| Germany |
35 days |
| Brazil |
34 days |
| United Kingdom |
28 days |
| Canada |
26 days |
| Korea |
25 days |
| Japan |
25 days |
| U.S |
13 days |
NOTE:
Countries and the average number of paid vacation days per year.
|
|
|
DIRECTORY OF STATE TRANSPORTATION LIBRARIES |
Julia Triplehorn
(907) 474-7512
Fax: (907)
474-7290
E-Mail: gilibrary@gi.alaska.edu
Alaska
Department of Transporation Library at
Geophysical
Institute/International Arctic Research Center
930 Koyukuk
Fairbanks, AK 99775
Alaska
Department of Transportation and Public Facilities
Alaska
Transportation Technology Transfer (T2) Center
2301 Peger Road
M/S 2550
Fairbanks, AK 99775 |
Dale
Steele
(602) 712-3138
Fax: (602) 712-3400
E-Mail: dsteele@azdot.gov
Arizona Transportation Research Center
Arizona Department of Transportation
206 S. 17th Ave. (MD # 075R)
Phoenix, AZ 85007 |
|
Janet Coles
(916) 657-5006
Fax: (916) 653-4560
E-Mail: library@dot.ca.gov
California
Department of Transportation
Transportation Library and
History Center
1120 N. Street, Room 1430
Sacramento, CA
95814 |
Joan Pinamont
(303) 757-9972
Fax: (303) 757-9974
E-Mail: joan.pinamont@dot.state.co.us
Colorado Department of Transportation
Library
4670 Holly St.
Denver, CO 80216-6408 |
Betty Ambler
(860) 594-3035
Fax: (860) 594-3039
E-Mail: betty.ambler@po.state.ct.us
ConnDOT Library and Information Center
2800 Berlin
Turnpike
Newington, CT 06111-4113 |
Sandy Bell
(850) 414-4614
Fax: (850) 413-0657
E-Mail: sandra.bell@dot.state.fl.us
Florida Department of Transportation
Research Center,
Mail Station 30
605 Suwannee St.
Tallahassee, FL
32399-0450 |
Stardina Wyche
(404) 363-7540
Fax: (404) 363-7684
E-Mail: stardina.wyche@dot.state.ga.us
Georgia Department of Transportation
Roy A. Flynt
Memorial Library
15 Kennedy Drive
Forest Park, GA 30297
|
Matthew E. Moore, Research Program Manager
(208)
334-8296
Fax: (208) 334-4432
E-Mail: matthew.moore@itd.idaho.gov
Idaho
Transportation Department
P.O. Box 7129
Boise, ID
83707-1129 |
| Karen
Perrin
(217) 782-6680
Fax: (217) 524 3834
E-Mail: Karen.Perrin@illinois.gov
Illinois Department of Transportation
Policy &
Research Center, Rm. 320
2300 S. Dirksen Parkway
Springfield, IL 62764-0001 |
Hank Zaletel
(515) 239-1200
Fax: (515) 233-7840
E-Mail: hank.zaletel@dot.iowa.gov
Iowa
Department of Transportation Library
800 Lincoln Way
Ames, IA 50010 |
|
Marie Manthe
(785) 291
3854
Fax: (785) 291-3717
E-Mail:
Marie.Manthe@ksdot.org
Kansas Department of Transportation Library
700 SW
Harrison St.
Topeka, KS 66603-3754 |
Laura Whayne
(859)-257-2155
Fax: (859) 257-1815
E-Mail: lwhayne@engr.uky.edu
Kentucky Transportation Center
University of Kentucky
176 Raymond Bldg.
Lexington, KY 40506-0281 |
|
Sandy Brady
Librarian & Transportation Research
Advisor
(225) 767-9716
Fax: (225) 767-9733
E-Mail: SandraBrady@dotd.la.gov
Louisiana Transportation Research Center, TTEC
4099 Gourrier Avenue
Baton Rouge, LA 70808
|
Pamela Shofner
(207) 624-3230
Fax: (207)
624-3221
E-Mail: Pamela.shofner@maine.gov
Maine Department of Transportation
Library
16 State House Station
Augusta, ME 04333-0016 |
Dr. Richard Woo
(410) 545-2916
Fax: (410) 209-5015
E-Mail: rwoo@sha.state.md.us
Maryland State Highway Administration
Library
707
N. Calvert St., C-409
Baltimore, MD 21202 |
Lynn Matis
(617) 973-8001
Fax: (617) 973-7153
E-Mail: library@mbta.com
Massachusetts State Transportation Library
10 Park Plaza
Boston, MA 02116 |
Alexandra
Briseno
MDOT Librarian
(517) 373-8548
Fax: (517)
241-3194
E-Mail: brisenoal@michigan.gov
Michigan
Department of Transportation
Office of Research and National
Best Practices, B155
425 West Ottawa Street
P.O. Box 30050
Lansing, MI 48909-7550
Sheila Hatchell
(651) 366-3733
Fax: (651) 366-3789
E-Mail:
sheila.hatchell@state.mn.us
Minnesota Department of Transportation
Mn/DOT
Library, M.S. 155, Room 175
395 John Ireland Blvd.
St. Paul,
MN 55155 |
Arlene
Mathison
(612) 624-3646
Fax: (612) 625-6381
E-mail: library@cts.umn.edu
Center for Transportation Studies
University of
Minnesota
200 Transportation & Safety Building
511
Washington Ave. SE
Minneapolis, MN 55455 |
Tina Leavy
(601) 359-7650
Fax: (601) 359-7634
E-Mail: tleavy@mdot.state.ms.us
Mississippi Department of Transportation
Research
Division
P.O. Box 1850
Jackson, MS 39215-1850 |
A.J.
Million
(573) 751-3075
Fax: (573) 526-1142
E-Mail: anthony.million@sos.mo.gov
Missouri
Department of Transportation Library
600 W. Main St.
P.O.
Box 387
Jefferson City, MO 65101 |
Lisa Autio
406 444-6125
Fax: 406 444-7204
E-Mail: lautio@mt.gov
Montana
Department of Transportation
Pavement Analysis and Research
2701 Prospect Avenue
P.O. Box 201001
Helena, MT 59620 |
Mary Neben
(402) 479-4316
Fax: (402) 479-3989
E-Mail:
maito:mary.neben@nebraska.gov
Nebraska Department of Roads
Resource Library
1500 Nebraska Highway 2
P.O. Box 94759
Lincoln, NB
68509-4759 |
| Heidi Wood
(775) 888-7895
Fax: (775) 888-7320
E-mail: hwood@dot.state.nv.us
Nevada Department
of Transportation
1263 S. Stewart Street, Room 115
Carson City, NV 89712 |
Carol Paszamant
(609) 530-5289
Fax: (609) 530-2052
E-Mail: carol.paszamant@dot.state.nj.us
New Jersey Department of Transportation
Research Library
P.O. Box 600
Trenton, NJ
08625-0600 |
| Krystyna Cherry,
Librarian
(505) 841-9150
Fax: (505) 841-9158
Email: krystyna.cherry@state.nm.us
New Mexico Department of Transportation Research Bureau
7500 Pan American Freeway NE
Box 94690
Albuquerque,
NM 87199-4690 |
Jane
Minotti
(518) 485-2077
Fax: (518) 457-7535
E-Mail: jminotti@dot.state.ny.us
New
York State Department of Transportation
Library
50 Wolf
Road, POD 34
Albany, NY 12232 |
Birch C.
Barnes
Librarian
(919) 508-1820
Fax: (919)
715-0137
E-mail: bbarnes@ncdot.gov
North
Carolina Department of Transportation
NCDOT, Research &
Analysis
104 Fayetteville Street
1549 Mail Service Center
Raleigh, NC 27699-1549 |
Gerri Weisgerber
(701) 328-6901
Fax: (701) 328-6913
E-mail: gweisger@nd.gov
North Dakota
Department of Transportation
Materials and Research Division
300 Airport Road
Bismarck, ND 58504-6005 |
Zona Kahkonen Keppler
(614)-466-2882
Fax: (614)
728-6694
E-Mail: Zona.Kahkonen.Keppler@dot.state.oh.us
Ohio Department of Transportation
Library, 2nd
floor
1980 W. Broad Street
Columbus, OH 43223 |
Ron
Curb
(425)-522-3795
E-Mail: rcurb@odot.org
Oklahoma
Department of Transportation
Research Division, Room 3A7
200 N.E. 21st Street
Oklahoma City, OK 73105-3204
|
Laura
Wilt
(503) 986-3280
Fax: (503) 986-4025
E-Mail: laura.e.wilt@odot.state.or.us
Oregon Department of Transportation
Library
Information Resource Center
355 Capitol Street N.E., Room 22
Salem, OR 97301-3871 |
Bonnie Fields
(717) 214-8686
Fax: (717) 783-9152
E-Mail: bfields@state.pa.us
Pennsylvania Department of Transportation
PennDOT Library & Research Center
P.O. Box 3054
Harrisburg, PA 17105-3054 |
Virginia Ripley
(605) 773-3292
Fax: (605) 773-4713
E-Mail:
virginia.ripley@state.sd.us
South Dakota Department of Transportation
Office of Research
700 East Broadway Avenue
Pierre, SD
57501-2586 |
Ruth Letson (Retired)
(615) 741-2330
Fax: (615)
741-1791
E-Mail:
ruth.letson@state.tn.us
Tennessee Department of Transportation
Library, Suite
300
James K. Polk Building
Nashville, TN 37243-0345
|
Louise
Rosenzweig
(512) 232-3138
Fax: 232-3088
E-Mail:
louise.rosenzweig@mail.utexas.edu
Center for Transportation Research
University
of Texas
3208 Red River #200
Austin, Texas 78705 |
Joni DeMille
Research Technology
Transfer Technician
(801) 965-4626
Cell: (801)
633-2835
Fax: (801) 965-4420
E-Mail:
mailto:jdemille@utah.gov
Utah Department of Transportation
Lester Wire
Library
4501 South 2700 West, 1st Floor
Box 141650
Salt
Lake City, UT 84114-1650 |
|
Sandy Aja
(802) 828-2544
Fax: (802) 828-3983
E-Mail: sandy.aja@state.vt.us
Vermont Agency of Transportation
Policy and Planning
Division
National Lise Building, Drawer 33
Montpelier, VT
05633-5001 |
Ken Winter
(804) 293-1959
Fax: (804) 293-1990
E-Mail: Ken.Winter@VDOT.Virginia.gov
Virginia Transportation Research Council
Library
530 Edgemont Road
Charlottesville, VA 22903 |
|
Kathy Szolomayer
(360) 705-7751
Fax: (360) 705-6831
E-Mail:
Szolomk@wsdot.wa.gov
Washington State Department of Transportation
WSDOT
HQ Library
P.O. Box 47425
310 Maple Park Ave. SE
Olympia, WA 98504-7425 |
Rebecca Christie
(360) 709-5404
Fax: (360) 709-5588
E-Mail: ChrisRe@wsdot.wa.gov
WSDOT Materials Laboratory Library
P.O. Box 47365
1655 S
Second Ave.
Tumwater, WA 98512-6951 |
John Cherney
(608) 266-0724
Fax: (608) 261-6303
E-Mail: john.cherney@dot.wi.gov
Wisconsin Department of Transportation
Library
4802 Sheboygan, Room 100
Madison, WI 53707
| Bob
Cullen
(202) 624-8918
Fax: (202) 624-5469
E-Mail: bobc@aashto.org
AASHTO
Information Center
444 N. Capitol St., N.W.
Suite 249
Washington, DC 20001 |
Jennifer
Boteler, Managing Librarian
(202) 493-3071
Fax: (202)
493-3495
E-Mail: Jennifer.Boteler@fhwa.dot.gov
Federal Highway Administration Research
Library
Turner-Fairbank Highway Research Center
6300
Georgetown Pike
McLean, VA 22101-2296
|
Barbara Post
(202) 334-2990
E-Mail: bpost@nas.edu
Jessica
Fomalont
(202) 334-2989
E-Mail: jfomalont@nas.edu
Fax: (202)
334-2527
Transportation Research Board
Library
Transportation Research Board Library
Keck
440
500 Fifth St. NW
Washington, DC 20001 |
|
|
Greenhouse Gases Program
Fuel and Energy Source Codes and Emission Coefficients
Fuel |
Code
|
Emission Coefficients
|
Pounds CO2 per Unit
Volume or Mass
|
Pounds CO2 per
Million Btu |
| Petroleum Products
|
| Aviation Gasoline |
AV |
18.355 |
per gallon |
152.717 |
| |
|
770.916 |
per barrel |
|
| Distillate Fuel (No. 1, No. 2, No. 4 Fuel Oil
and Diesel) |
DF |
22.384 |
per gallon |
161.386 |
| |
|
940.109 |
per barrel |
|
| Jet Fuel |
JF |
21.095 |
per gallon |
156.258 |
| |
|
885.98 |
per barrel |
|
| Kerosene |
KS |
21.537 |
per gallon |
159.535 |
| |
|
904.565 |
per barrel |
|
| Liquified Petroleum Gases (LPG) |
LG |
12.805 |
per gallon |
139.039 |
| |
|
537.804 |
per barrel |
|
| Motor Gasoline |
MG |
19.564 |
per gallon |
156.425 |
| |
|
822.944 |
per barrel |
|
| Petroleum Coke |
PC |
32.397 |
per gallon |
225.130 |
| |
|
1356.461 |
per barrel |
|
| |
|
6768.667 |
per short ton |
|
| Residual Fuel (No. 5 and No. 6 Fuel Oil) |
RF |
26.033 |
per gallon |
173.906 |
| |
|
1,093.384 |
per barrel |
|
| |
| Natural Gas and Other
Gaseous Fuels |
| Methane |
ME |
116.376 |
per 1000 ft3 |
115.258 |
| Landfill Gas |
LF |
1 |
per 1000 ft3 |
115.258 |
| Flare Gas |
FG |
133.759 |
per 1000 ft3 |
120.721 |
| Natural Gas (Pipeline) |
NG |
120.593 |
per 1000 ft3 |
117.080 |
| Propane |
PR |
12.669 |
per gallon |
139.178 |
| |
|
532.085 |
per barrel |
|
| |
| Electricity |
EL |
Varies depending on fuel used to generate electricity
|
| Electricity Generated from Landfill Gas |
LE |
Varies depending on heat rate of the power generating
facility |
| |
| Coal |
CL |
|
|
|
| Anthracite |
AC |
5685.00 |
per short ton |
227.400 |
| Bituminous |
BC |
4931.30 |
per short ton |
205.300 |
| Subbituminous |
SB |
3715.90 |
per short ton |
212.700 |
| Lignite |
LC |
2791.60 |
per short ton |
215.400 |
| |
| Renewable Sources
|
| Biomass |
BM |
Varies depending on the composition of the biomass
|
| Geothermal Energy |
GE |
0 |
|
0 |
| Wind |
WN |
0 |
|
0 |
| Photovoltaic and Solar Thermal |
PV |
0 |
|
0 |
| Hydropower |
HY |
0 |
|
0 |
| Tires/Tire-Derived Fuel |
TF |
6160 |
per short ton |
189.538 |
| Wood and Wood Waste 2 |
WW |
3812 |
per short ton |
195.0 |
| Municipal Solid Waste 2 |
MS |
1999 |
per short ton |
199.854 |
| |
| Nuclear |
NU |
0 |
|
0 |
| |
| Other |
ZZ |
0 |
|
0 |
|
1 For a landfill gas coefficient per
thousand standard cubic foot, multiply the methane factor by
the share of the landfill gas that is methane.
2 These biofuels contain "biogenic"
carbon. Under international greenhouse gas accounting methods
developed by the Intergovernmental Panel on Climate Change,
biogenic carbon is part of the natural carbon balance and it
will not add to atmospheric concentrations of carbon
dioxide.3
Reporters may wish to use an emission factor of zero for wood,
wood waste, and other biomass fuels in which the carbon is
entirely biogenic. Municipal solid waste, however, normally
contains inorganic materials principally plastics that contain
carbon that is not biogenic. The proportion of plastics in
municipal solid waste varies considerably depending on
climate, season, socio-economic factors, and waste management
practices. As a result, EIA does not estimate a non-biogenic
carbon dioxide emission factor for municipal solid waste. The
U.S. Environmental Protection Agency estimates that, in 1997,
municipal solid waste in the United States contained 15.93
percent plastics and the carbon dioxide emission factor for
these materials was 5,771 lbs per ton.4
Using this information, a proxy for a national average
non-biogenic emission factor of 919 lbs carbon dioxide per
short ton of municipal solid waste can be derived. This
represents 91.9 lbs carbon dioxide per million Btu, assuming
the average energy content of municipal solid waste is 5,000
Btu/lb.
3 Intergovernmental Panel on Climate
Change. Greenhouse Gas Inventory Reference Manual: Revised
1996 IPCC Guidelines for National Greenhouse Gas
Inventories, Vol. 3, Pg. 6.28, (Paris France 1997).
4 U.S. Environmental Protection Agency,
Inventory of U.S. Greenhouse Gas Emissions and Sinks:
1990-1998, EPA 236-R-00-001, Washington, DC, April 2000.
|
|
|
Table 4-49: 1990-1998 U.S. Carbon Dioxide Emissions from Energy Use by Sector
(Million metric tons of carbon)
| Total U.S.
CO2 Emissions from energy use by sector |
1,369.0 |
1,356.7 |
1,382.4 |
(R)
1,410.4 |
(R)
1,431.9 |
(R)
1,445.9 |
(R)
1,496.5 |
(R)
1,516.8 |
(R)
1,528.5 |
| Transportation |
432.8 |
427.2 |
433.0 |
439.2 |
450.5 |
458.7 |
470.5 |
(R)
475.5 |
485.3 |
| Natural gas |
9.8 |
9.0 |
8.8 |
9.3 |
10.3 |
(R)
10.5 |
(R)
10.7 |
(R)
11.3 |
9.6 |
| Electricity |
0.9 |
0.9 |
0.8 |
0.9 |
0.9 |
0.9 |
0.9 |
0.9 |
0.9 |
| Petroleum |
422.0 |
417.3 |
423.4 |
429.0 |
439.3 |
447.4 |
459.0 |
463.4 |
474.8 |
| Motor gasoline |
263.5 |
262.1 |
266.0 |
272.6 |
275.9 |
280.8 |
285.6 |
288.2 |
296.6 |
| Liquid petroleum gas |
0.4 |
0.3 |
0.3 |
0.3 |
0.6 |
0.3 |
0.3 |
0.2 |
0.3 |
| Jet fuel |
60.7 |
58.7 |
58.2 |
58.7 |
61.0 |
60.6 |
63.3 |
63.9 |
64.9 |
| Distillate fuel |
73.0 |
71.8 |
73.5 |
75.7 |
80.4 |
83.7 |
89.2 |
93.2 |
96.0 |
| Residual fuel |
21.8 |
22.0 |
23.0 |
19.4 |
19.0 |
19.6 |
18.3 |
15.3 |
14.5 |
| Lubricants |
1.8 |
1.6 |
1.6 |
1.7 |
1.7 |
1.7 |
1.6 |
1.7 |
1.8 |
| Aviation gas |
0.8 |
0.8 |
0.8 |
0.7 |
0.7 |
0.7 |
0.7 |
0.7 |
0.7 |
| Industrial |
460.7 |
449.2 |
468.4 |
(R)
466.8 |
(R)
475.1 |
(R)
474.4 |
(R)
488.6 |
(R)
494.2 |
(R)
488.8 |
| Residential |
261.4 |
265.8 |
266.2 |
(R)
282.5 |
(R)
280.7 |
(R)
282.4 |
(R)
298.6 |
(R)
296.2 |
(R)
298.2 |
| Commercial |
214.1 |
214.4 |
214.8 |
(R)
221.8 |
(R)
225.7 |
(R)
230.5 |
(R)
238.9 |
(R)
250.8 |
(R)
256.3 |
| Total U.S.
CO2 Emissions (Incl. adj. and other
sources)a |
1,369.6 |
1,357.1 |
1,386.0 |
(R)
1,419.0 |
(R)
1,442.5 |
(R)
1,456.6 |
(R)
1,507.1 |
(R)
1,525.7 |
(R)
1,534.5 |
KEY: CO2 = carbon dioxide; R = revised.
a "Adjustments" comprise the addition of U.S.
territories and the subtraction of military bunker fuels and international
bunker fuels. "Other sources" include emissions from industrial processes, such
as cement and limestone production.
NOTES
Electric utility emissions are distributed across end-use
sectors.
Numbers may not add to totals due to independent rounding.
Tons of carbon can be converted to tons of carbon dioxide gas
through multiplying by 3.667. One ton of carbon equals 3.667 tons of carbon
dioxide gas.
Numbers in this table may not be comparable to the numbers in the
previous edition of the report due to changes in methodology of estimation by
the Energy Information Administration.
SOURCE
U.S. Department of Energy, Energy Information Administration,
Emissions of Greenhouse Gases in the United States 2008, (Washington, DC:
2008)
|
|
Table 4-49: 1999-2008 U.S. Carbon Dioxide Emissions from Energy Use by Sector
(Million metric tons of carbon)
| Total U.S.
CO2 Emissions from energy use by sector |
(R)
1,544.9 |
(R)
1,595.4 |
1,566.8 |
1,578.8 |
(R)
1,592.2 |
(R)
1,623.3 |
1,629.2 |
1,607.2 |
1,632.5 |
1,585.6 |
| Transportation |
498.6 |
510.7 |
504.9 |
515.6 |
517.4 |
534.2 |
542.3 |
549.3 |
552.4 |
526.3 |
| Natural gas |
9.8 |
9.7 |
9.5 |
10.2 |
9.1 |
8.7 |
9.0 |
9.0 |
9.6 |
9.8 |
| Electricity |
0.9 |
1.0 |
1.0 |
1.0 |
1.2 |
1.3 |
1.3 |
1.3 |
1.4 |
1.3 |
| Petroleum |
487.9 |
500.0 |
494.3 |
504.4 |
(R)
507.1 |
524.2 |
532.0 |
539.0 |
541.4 |
515.2 |
| Motor gasoline |
304.1 |
306.0 |
307.4 |
315.3 |
(R) 316.3 |
322.1 |
322.9 |
323.7 |
323.8 |
309.5 |
| Liquid petroleum gas |
0.2 |
0.2 |
0.2 |
0.2 |
0.3 |
0.3 |
0.5 |
0.4 |
0.4 |
0.3 |
| Jet fuel |
66.9 |
69.2 |
66.2 |
64.6 |
63.1 |
65.4 |
67.2 |
65.3 |
64.9 |
61.7 |
| Distillate Fuel |
99.8 |
103.0 |
105.6 |
107.6 |
113.0 |
118.3 |
121.2 |
128.0 |
128.8 |
121.5 |
| Residual Fuel |
14.3 |
19.1 |
12.6 |
14.5 |
12.3 |
15.9 |
18.0 |
19.5 |
21.4 |
20.2 |
| Lubricants |
1.8 |
1.8 |
1.7 |
1.6 |
1.5 |
1.5 |
1.5 |
1.5 |
1.5 |
1.4 |
| Aviation Gas |
0.7 |
0.7 |
0.7 |
0.6 |
0.6 |
0.6 |
0.7 |
0.6 |
0.6 |
0.5 |
| Industrial |
(R)
482.1 |
(R)
486.7 |
465.6 |
459.1 |
(R)
460.9 |
(R)
471.4 |
455.8 |
452.1 |
451.4 |
433.4 |
| Residential |
(R)
304.5 |
(R)
321.7 |
318.3 |
326.6 |
(R)
334.0 |
(R)
333.2 |
342.1 |
323.6 |
336.8 |
332.7 |
| Commercial |
(R)
259.7 |
(R)
276.3 |
278.0 |
277.6 |
(R)
279.8 |
(R)
284.5 |
289.0 |
282.2 |
291.9 |
293.2 |
| Total U.S.
CO2 Emissions (Incl. adj. and other
sources)a |
(R)
1,553.1 |
(R)
1,605.2 |
1,580.7 |
1,595.1 |
(R)
1,611.4 |
(R)
1,638.9 |
1,644.1 |
1,616.8 |
1,640.9 |
1,592.4
|
KEY: CO2 = carbon dioxide; R = revised.
a "Adjustments" comprise the addition of U.S.
territories and the subtraction of military bunker fuels and international
bunker fuels. "Other sources" include emissions from industrial processes, such
as cement and limestone production.
NOTES
Electric utility emissions are distributed across end-use
sectors.
Numbers may not add to totals due to independent rounding.
Tons of carbon can be converted to tons of carbon dioxide gas
through multiplying by 3.667. One ton of carbon equals 3.667 tons of carbon
dioxide gas.
Numbers in this table may not be comparable to the numbers in the
previous edition of the report due to changes in methodology of estimation by
the Energy Information Administration.
SOURCE
U.S. Department of Energy, Energy Information Administration,
Emissions of Greenhouse Gases in the United States 2008, (Washington, DC:
2008)
|
|
RAILWAY BUSINESS CAR SERVICES
All Inquires submitted To: rbcs@usa.com
![[Email Us]](http://www.atdlines.com/images/mailbutn.gif)
|
![Crossing Gate]](http://www.atdlines.com/motion/train6.gif)
© Copyright 1981-
ATD LINES All Rights Reserved
Not affilated nor owned by NRPC-Amtrak
|
| | |
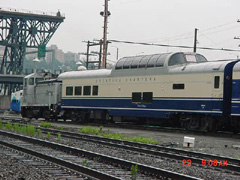
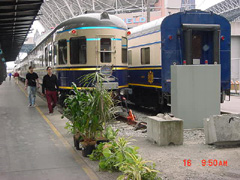
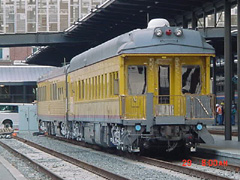
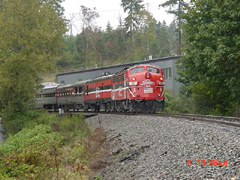
![Power By ETS]](http://www.atdlines.com/images/power.gif)